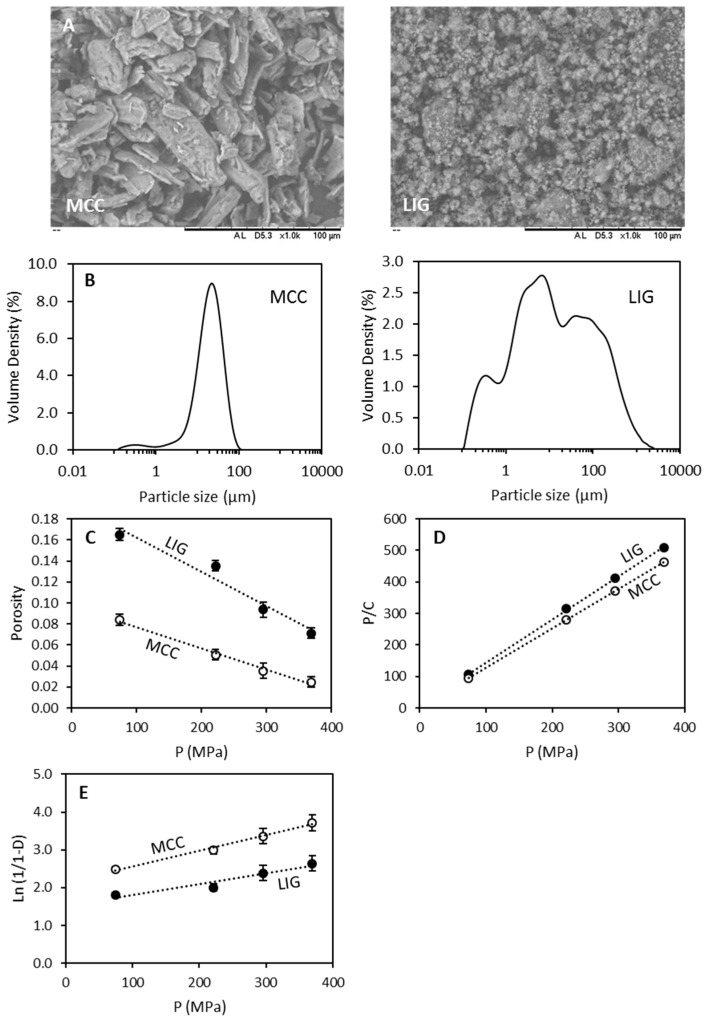
Figure 1.
SEM images showing the morphology of microcrystalline cellulose (MCC) and lignin (LIG) powder (A). The scale bar in all cases represents 100 µm. Particle size distribution for MCC and LIG powders (B). Porosity of LIG and MCC as a function of the pressure (C) Kawakita plots for LIG and MCC powders (D). Heckel plots for LIG and MCC (E).

