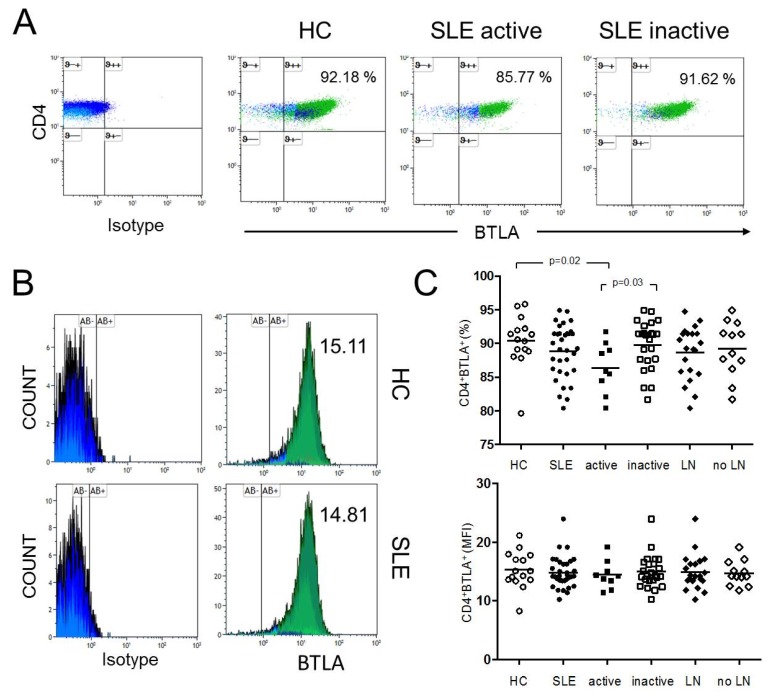
Figure 1.
(A) This figure shows a representative dot plot of B- and T-lymphocyte attenuator (BTLA) expression on unstimulated CD4+ T-cells of a healthy control (HC) and of an active and inactive systemic lupus erythematosus (SLE) patient. (B) The histograms indicate the mean fluorescence intensity (MFI) of BTLA on unstimulated CD4+ T-cells of a HC and an SLE patient. (C) The summary of the results for HC (n = 15), all SLE patients (SLE, n = 33), active disease (active, n = 9), inactive disease (inactive, n = 24) and patients with lupus nephritis (LN, n = 21) and without LN (no LN, n = 12) is shown. Horizontal lines represent the mean values. p-values were calculated using the nonparametric Mann–Whitney U-test.

