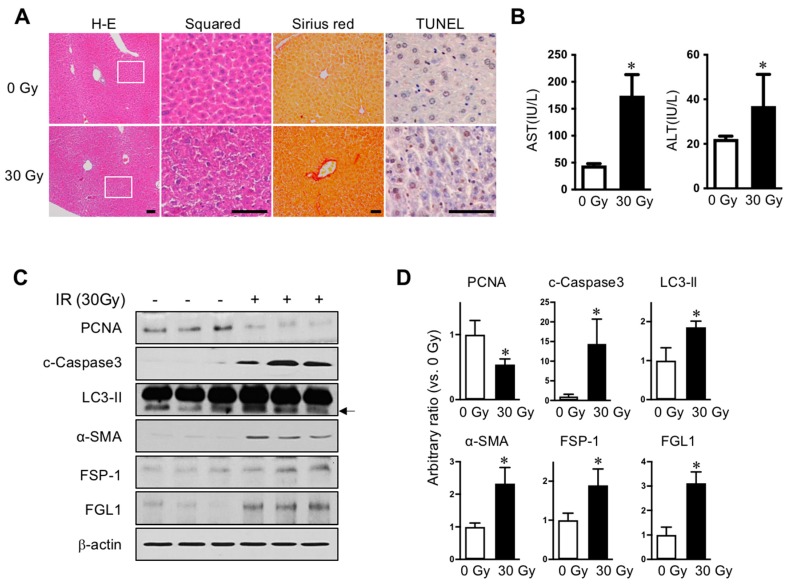
Figure 1.
Radiation-induced liver injury and FGL1 expression. (A) Representative liver histology showing hematoxylin and eosin (H–E), Sirius red, and TUNEL assay. Inserts show higher magnification. Scale bar: 100 μm. (B) Serum alanine transaminase (ALT)/aspartate transaminase (AST) level (n = 5 mice/group). Mean ± SD results are graphed (unpaired two-sample Student’s t-test, * p < 0.05 compared to 0 Gy control). (C) Representative images and (D) quantitative data show alterations of PCNA, cleaved caspase-3, LC3-II, α-SMA, FSP-1 and FGL1. β-actin was used as the loading control. Western blotting was performed using liver tissues harvested at 7 days after IR. Data represented Mean ± SD (n = 3, * p < 0.05 vs. non-irradiated control).

