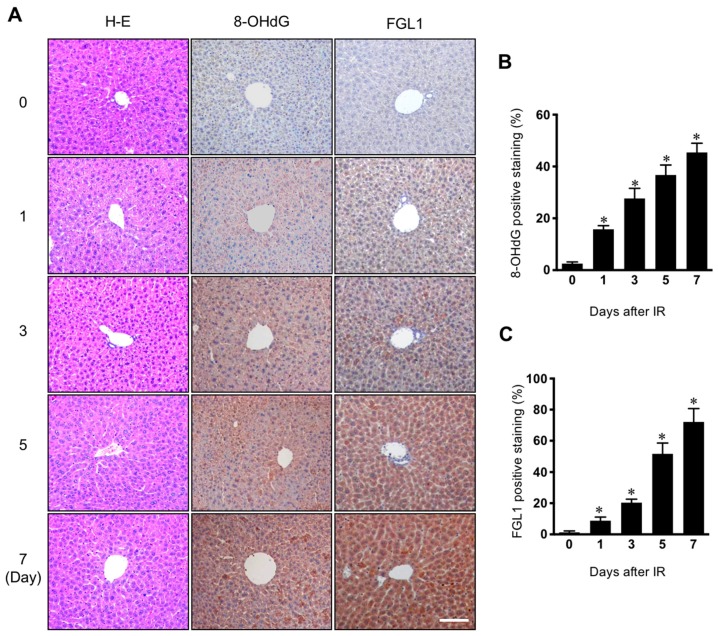
Figure 2.
Expression of 8-OHdG and FGL1 in the liver following 30 Gy of whole liver irradiation. (A) Liver section stained at various days after IR. Hematoxylin-eosin (H–E), FGL1, and 8-hydroxy-2′-deoxyguanosine (8-OHdG) expression in the liver was determined by immunohistochemistry. Scale bar: 100 μm. (B,C) Quantification of the positive signal of FGL1 and 8-OHdG in a unit area at the indicated. Data represented Mean ± SD (n = 5, * p < 0.05 vs. the day 0 control).

