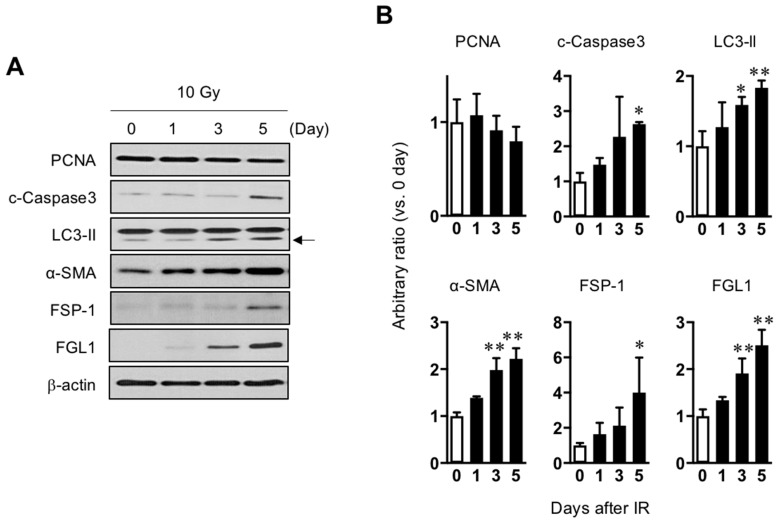
Figure 3.
Association between radiation-induced hepatocyte damage and FGL1 expression. (A) Western blots analysis of lysates from hepatocytes treated with 10 Gy of radiation for PCNA, cleaved caspase-3, LC3-II, α-SMA, FSP-1, and FGL1 at the indicated days. (B) The indicated protein expression is represented as relative values compared with the non-irradiated control in the graph. Data represented Mean ± SD (n = 3, * p < 0.05 or ** p < 0.01 compared to the day 0 control).

