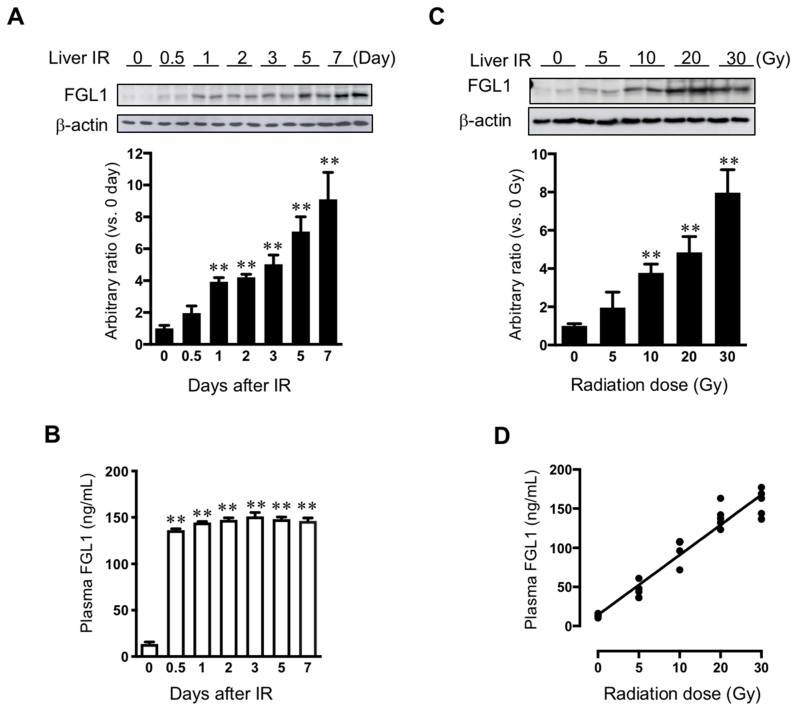
Figure 6.
Expression of FGL1 in liver tissue and plasma following liver IR. (A) FGL1 expression in total protein extract from the liver and (B) mouse plasma at days 0–7 following 30 Gy of liver IR. (C) FGL1 induction in the liver and of mice following indicated radiation dose of liver IR at 3 days post-IR. Data represent the means ± SD (** p < 0.01, n = 5). (D) The relationship between in the plasma FGL1 concentration and radiation dose (R2 = 0.93, p < 0.0001).

