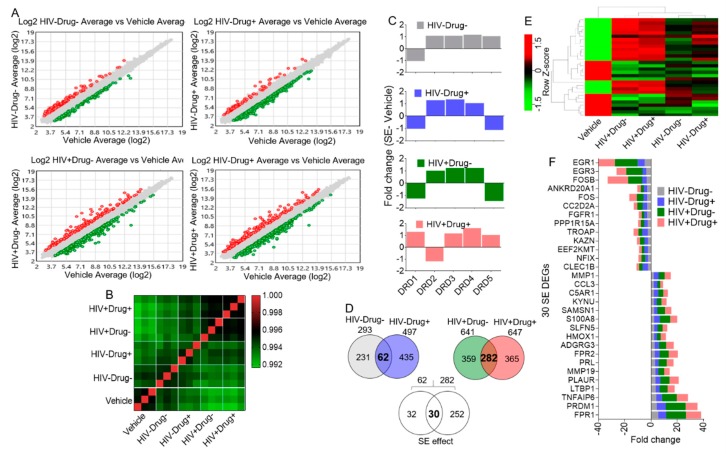
Figure 2.
Microarray analysis of monocytes (n = 15) treated with vehicle or SE from different clinical groups (triplicate per treatment): (A) Scatter plots of the different SE treatments compared to the vehicle control. Red and green dots correspond to the significantly up- and downregulated genes, respectively. Gray dots correspond to the unchanged genes. (B) Correlation matrix of all genes (21448) showing a differential pattern in monocyte gene expression. (C) Gene expression levels of dopamine receptors as determined by microarray analysis. Differences were not significant with the set filtration criteria of fold change (FC) < −2 or FC > 2 and p-value < 0.05 (Benjamini and Hochberg correction for multiple observations). (D) Venn diagram analysis showing 30 differentially expressed genes (DEGs) common to all SE (HIV−Drug−, HIV−Drug+, HIV+Drug−, HIV+Drug+) treatments. The bold fonts in the Venn diagrams are the numbers of interest. (E) Hierarchical clustering heatmap showing the overall expression of the 30 SE-DEG. (F) Bar graph showing the fold change of each of the 30 SE-DEGs as compared to vehicle.

