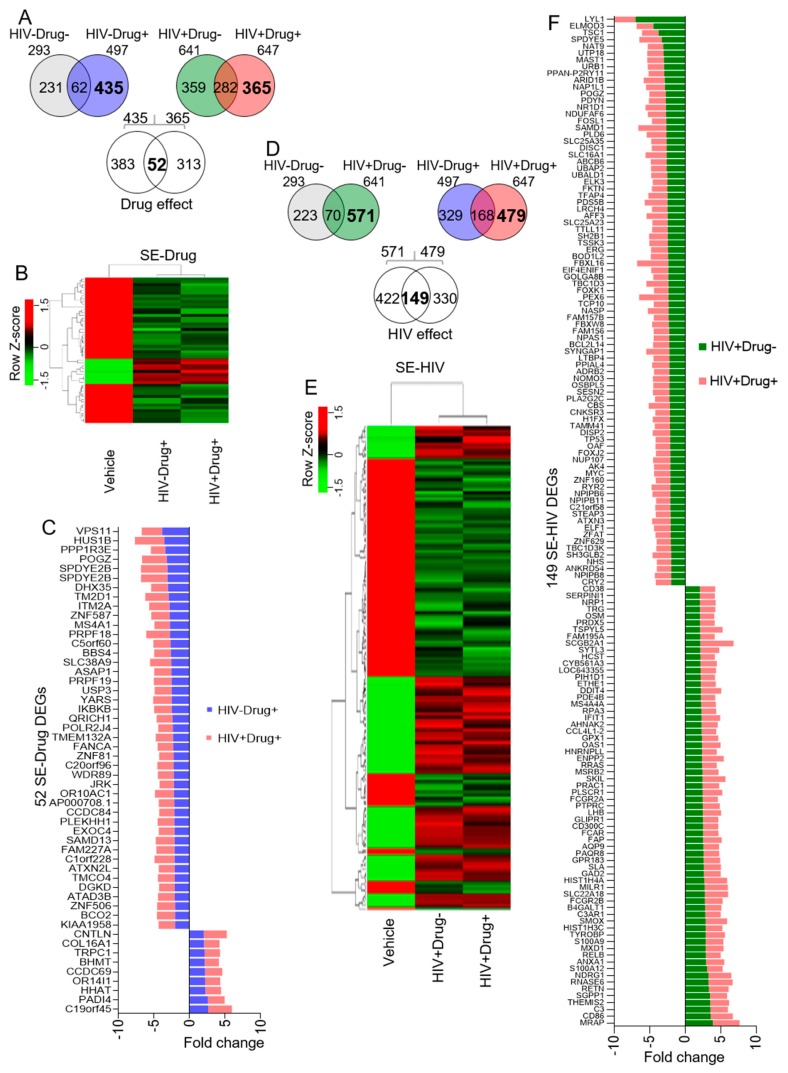
Figure 3.
Microarray analysis of SE-treated monocytes showing the effect of psychostimulant use and HIV infection on SE function: (A) Venn diagram showing 52 DEGs exclusive to the alterations induced by treatment with HIV−Drug+ and HIV+Drug+ SE (SE-Drug). (B) Hierarchical clustering heatmap showing the overall and direction of expression of the 52 SE-Drug. (C) Bar graph showing the fold change of the 52 SE-DEGs as compared to vehicle. (D–F) Similar analyses as in Figure 3A–C showing 149 HIV exclusive DEGs in cells treated with HIV+Drug− and HIV+Drug+ SE (SE-HIV). The bold fonts in the Venn diagrams are the numbers of interest.

