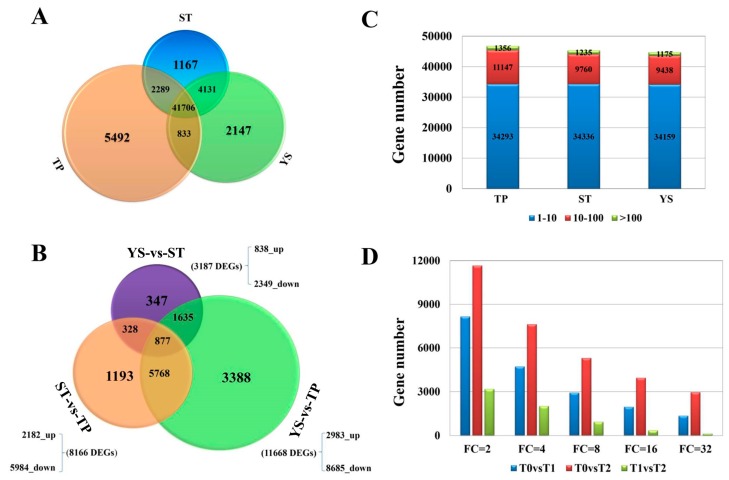
Figure 2.
The gene expression profiles in tiller primordia (TP), stem tips (ST), and young spikes (YS) of Guomai 301. (A) A Venn diagram showing the numbers of expressed genes in various samples, the FPKM is above 1 in all three replications. (B) Statistics of differentially expressed genes (DEGs) in each sample. (C) Numbers of genes expressed in each sample with an average number of fragments per kilobase of transcript per million mapped fragments (FPKM) ≥ 1. (D) numbers of DEGs with different Fold Changes.

