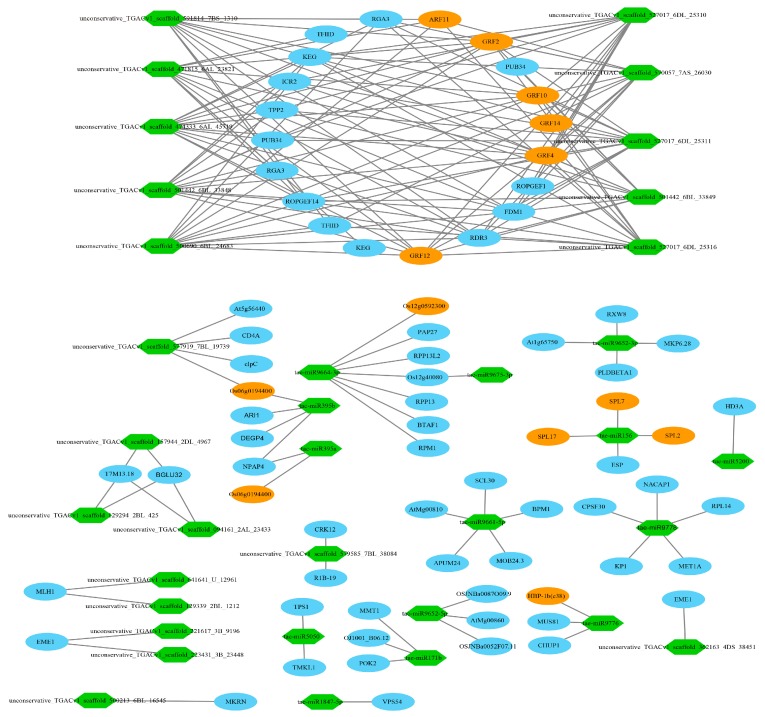
Figure 7.
A part of the 279 negative miRNA–mRNA interaction pairs (regulation network) in young spikes. Green hexagons represented the highly expressed miRNAs in young spikes. Ovals represented the target genes of miRNAs. Yellow ovals represented TFs. Higher resolution image is shown in Figure S9.

