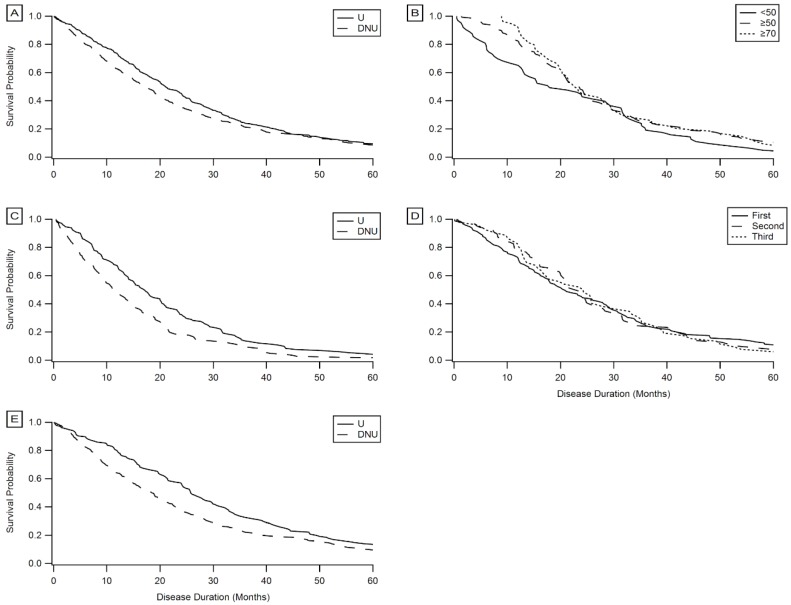
Figure 5.
Kaplan–Meier survival curves. (A) PEG users (n = 279) compared to non-users (n = 49). (B) PEG users with FVC %predict <50 at initial PEG placement (n = 57) compared with FVC %predict ≥50 (n = 124) and FVC %predict ≥70 (n = 54). (C) Bulbar onset PEG users (n = 133) compared with bulbar onset non-users (n = 64). (D) PEG users who began using PEG in the first trimester of disease duration (n = 116) compared with those who began in the second (n = 87) and third trimesters (n = 53). (E) Limb onset (n = 138) PEG users compared with limb onset non-users (n = 448).

