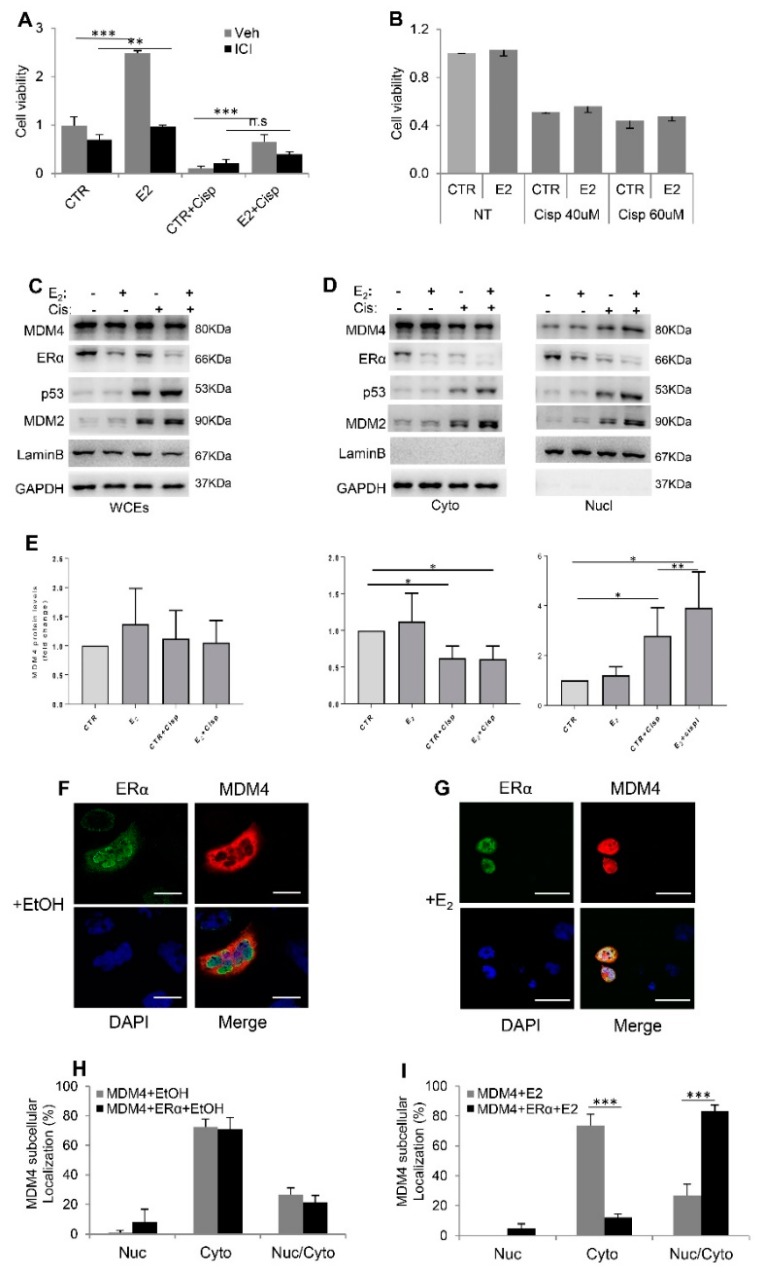
Figure 3.
E2 alters MDM4 subcellular localization. (A,B) Relative cell viability of MCF-7 (A) and MDA-MB-231 (B) by cell titer assay. Graphs show mean ± SD of two experiments performed in tetraplicate (Two-tailed unpaired t-test, (A) CTR vs. E2, t = 13.45, df = 4, *** p = 0.0002, CTR + Cisp vs. E2 + Cisp, t = 18.29, df = 8, *** p < 0.0001, CTR + ICI vs. E2 + ICI, t = 4.834 df = 6, ** p = 0.0029, CTR + Cisp + ICI vs. E2 + Cisp + ICI, t = 2.284, df = 6, p = 0.0624). (C,D) WB analysis of whole cell extracts (WCEs) (C) and cytoplasmic (Cyto) and nuclear extracts (Nucl) (D) of MCF-7 cells treated as indicated. Laminin and GAPDH were used as LC. (E) MDM4 levels under indicated treatments, relative to the untreated cells (CTR) arbitrarily set to 1 and corrected to the respective loading control. Mean ± SD of 4 independent biological replicates is shown (One sample t-test, Cyto graph: CTR + Cisp vs. CTR, DF = 3, t = 4.48, * p = 0.021, E2 + Cisp vs. CTR, DF = 3, t = 4,328, * p = 0.023; Nucl graph: CTR + Cisp vs. CTR, DF = 3, t = 3198, * p = 0,0494, E2 + Cispl vs. CTR, DF = 3, t = 4.034, * p = 0.0274; E2 + Cisp vs. CTR + Cisp Paired t-test DF = 3, t = 6.451, ** p = 0.0076). (F,G) Representative pictures of ERα (green) and MDM4 (red) exogenously expressed in A2780 cells treated as indicated for 20 h. Nuclei were counterstained with DAPI (blue) (scale bars, 50 µm). (H,I) Graphs show the percentage of A2780 cells showing only Nuclear (Nuc) or Cytoplasmic (Cyto) or Nuclear and Cytoplasmic (Nuc/Cyto) MDM4 signal relative to the total number of positive cells. Mean ± SD of 3 independent biological replicates is shown (Two-tailed unpaired t-test, (I) Cyto MDM4 + E2 vs. Cyto MDM4 + ERα + E2, t = 13.13, df = 4, *** p = 0.0002, Nuc/Cyto MDM4 + E2 vs. Nuc/Cito MDM4 + ERα + E2, t = 11.08, df = 4, *** p = 0.0004).

