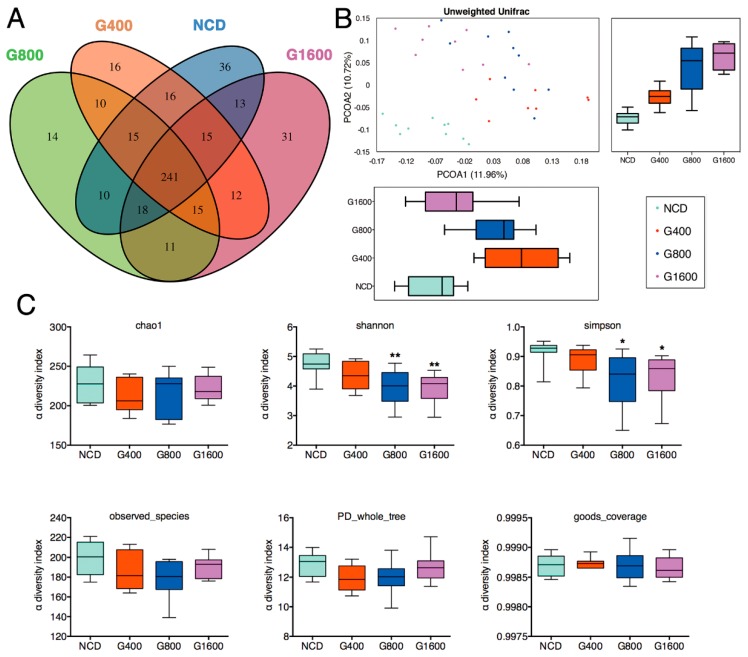
Figure 3.
Change in fecal microbiota in mice fed with different doses of GML-supplemented diets. (A) Venn diagram of OTUs. (B) β-diversity analysis was performed by using the unweighted version of the UniFrac-based PCoA. (C) α-diversity analysis based on indices of chao1, Shannon, Simpson, Observed species, PD whole tree and goods coverage. Data were means ± SD (n = 8–10); * p < 0.05 and ** p < 0.01 compared with the NCD group.

