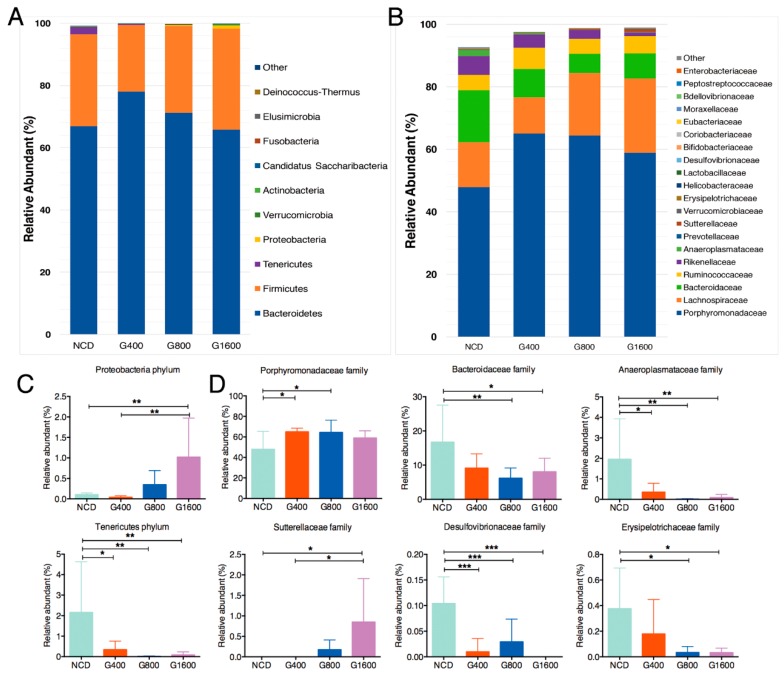
Figure 4.
GML altered the fecal microbiota composition in mice. Microbial taxonomic profiling in the (A) phylum level and (B) family level among different groups, and different colors represent different taxa. Relative abundance of the bacterial (C) phylum and (D) families that differentially detected in fecal samples. Results were expressed as mean ± SD (n = 8–10), * p < 0.05; ** p < 0.01; *** p < 0.001.

