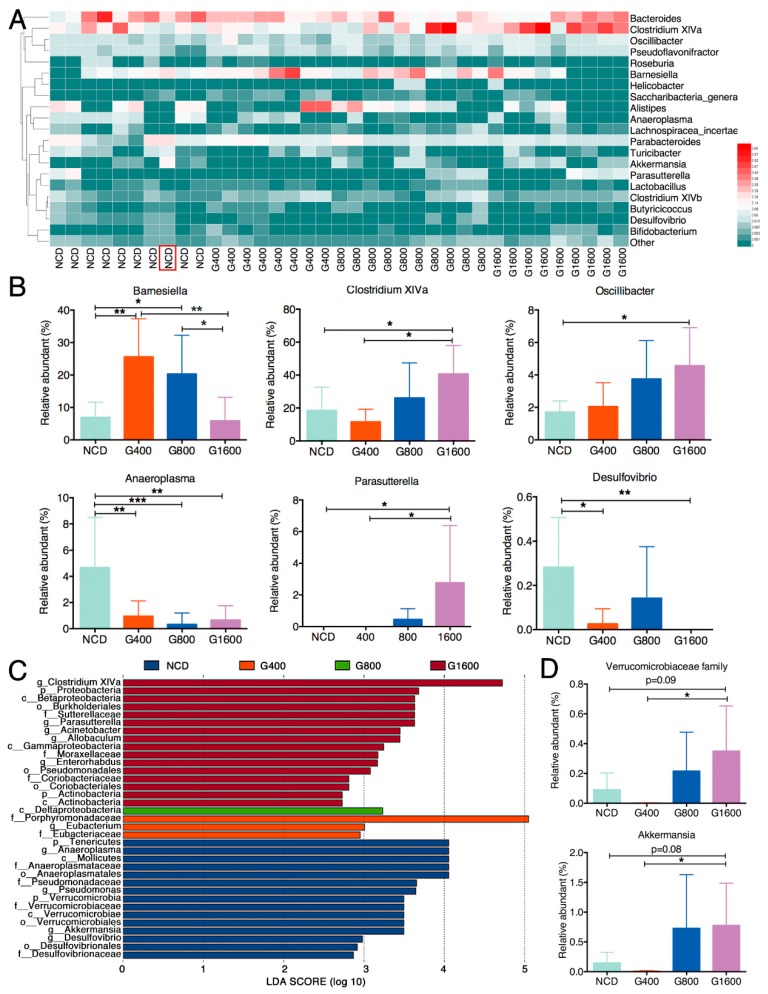
Figure 5.
GML altered the fecal microbiota composition in mice. (A) The heat map of the relative abundance of the top 20 genera among different groups. The red color indicates high values while the green color means low values. (B) Relative abundance of the bacterial genera that differentially detected in fecal samples among different groups. (C) a total of 35 taxa showed significant differences in their relative abundance among the NCD, G400, G800 and G1600 groups with 2.5 as LDA score threshold. (D) The relative abundance of genus Akkermansia among four groups after eliminating the outlier which were detected with the ROUT method (Q = 1%) using GraphPad Prism Version 6. Results were expressed as mean ± SD (n = 8–10), * p < 0.05; ** p < 0.01; *** p < 0.001.

