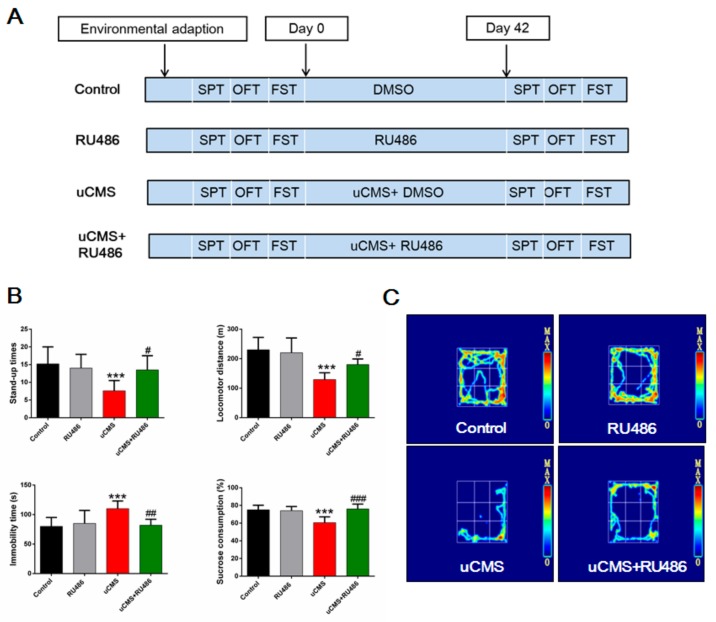
Figure 1.
Study design and verification of the uCMS model. (A) Schematic diagram of the study design. (B) Results of behavioral tests including OFT, FST, and SPT (n = 10). (C) Heat map of the rats’ motion trail in the OFT. Data were analyzed by one-way ANOVA with post hoc multiple comparisons test. *p < 0.05, **p < 0.01, and ***p < 0.001 compared with the control group; #p < 0.05, ##p < 0.01, and ###p < 0.001 compared with the uCMS group. uCMS = unpredictable chronic mild stress; ANOVA = analysis of variance; OFT = open field test; FST = forced swimming test; SPT = sucrose preference test.

