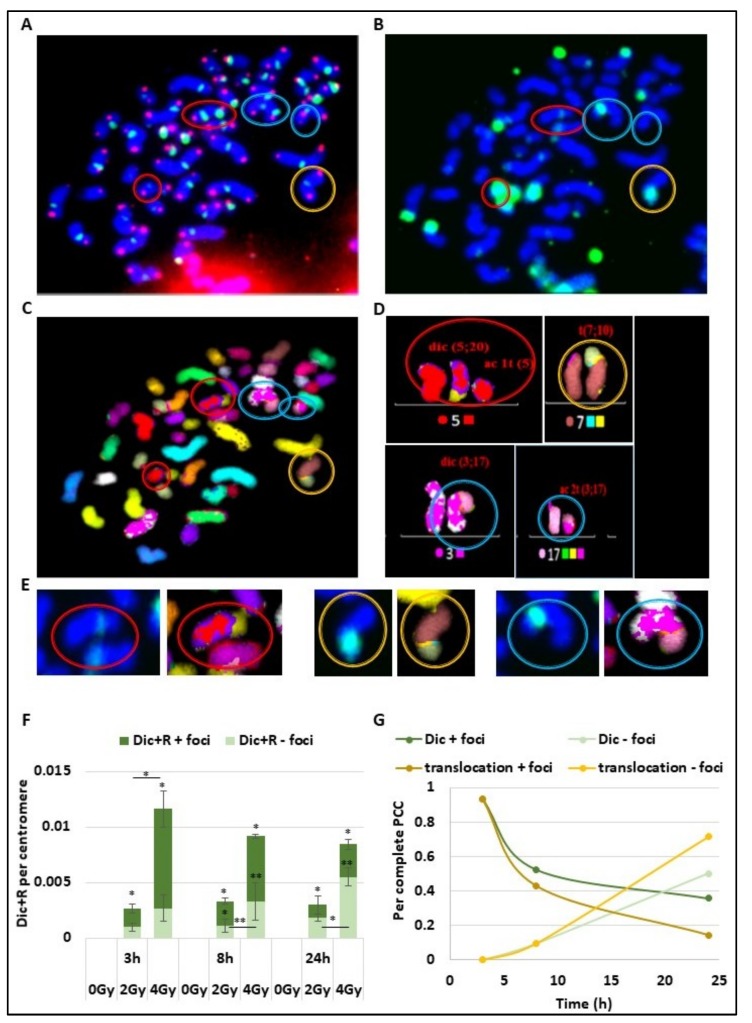
Figure 2.
γ-H2AX foci signalling of unstable and stable aberrations short time after irradiation. (A–D) The same slide with PCC lymphocyte cells previously irradiated with 4 Gy was observed after telomere (in red) and centromere staining (in green) (A), γ-H2AX immunofluorescence assays have been performed with a FITC-coupled antibody (green) (B) or multi-FISH (C) and analysed with the ISIS software. Four abnormalities were detected and marked with coloured circles. The red and blue circles show dicentric chromosomes and their corresponding acentric fragments. The yellow circle shows a translocation between chromosomes 7 and 10. (D) Chromosome karyotype using false colours was built using the ISIS software. Data obtained from Telomere and Centromere staining and from multi-FISH were assembled to detect unstable and stable aberrations. (E) Zoom of CA stained for γ-H2AX (green) and visualized after multi-FISH. The foci localized at the junction between two chromosomes. (F) Blood samples from three donors were irradiated at 2 or 4 Gy or kept free from ionising radiation before analysis using the PCC technique. Dic+R frequency per centromere was scored 3 h, 6 h, and 24 h after IR and the percentage of co-staining with γ-H2AX foci was determined (dark green). The increase of “Dic+R + foci” or “Dic+R – foci” is significant (* p < 0.05, ** p < 0.001) at the different time points compared to 0 Gy. There is significant differences when indicated between 2 Gy and 4 Gy irradiation (* p < 0.05, ** p < 0.001). (G) Only complete PCC cells (between 45 and 48 chromosome fragments) irradiated with 4Gy were analysed by multi-FISH after γ-H2AX foci immunofluorescence assay. Proportions of Dic+R and translocations signalled with γ-H2AX foci (in green part A) or without any γ-H2AX foci were represented over time. Respectively 15, 21, and 14 PCC were analysed for 0, 2, and 4 Gy exposure.

