Figure 3.
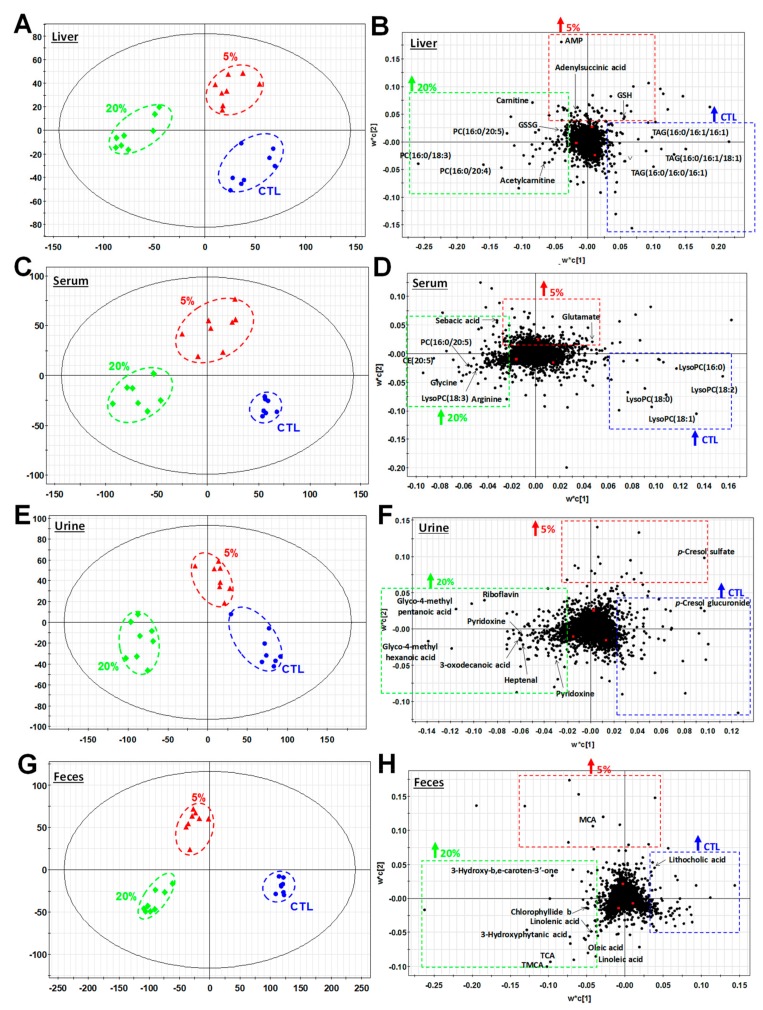
Effects of Scenedesmus diets on hepatic, serum, urinary, fecal metabolomes. Data from LC-MS analysis of liver extract, serum, urine and fecal extract were processed by supervised partial least squares-discriminant analysis (PLS-DA) modeling. The associations of metabolites representing each of the three groups of mice (n = 8/group) are shown in the scores plots. Selective metabolite markers correlating with the experimental diets are labeled in the loadings plots. (A) Scores plot of a PLS-DA model on liver extracts. (B) Loadings plot of a PLS-DA model on liver extracts. (C) Scores plot of a PLS-DA model on serum samples. (D) Loadings plot of a PLS-DA model on serum samples. (E) Scores plot of a PLS-DA model on urine samples. (F) Loadings plot of a PLS-DA model on urine samples. (G) Scores plot of a PLS-DA model on fecal samples. (H) Loadings plot of a PLS-DA model on fecal samples. The symbol “↑” in the loadings plot indicates positive correlation with individual treatment.

