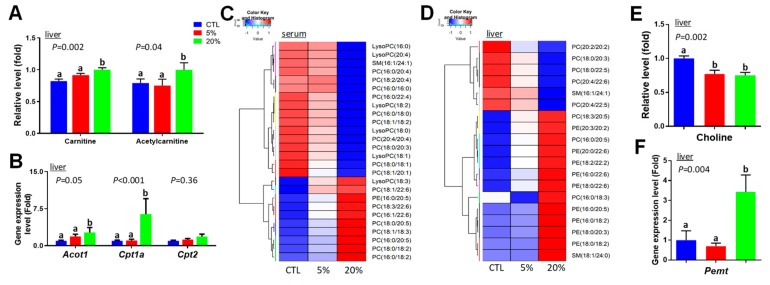
Figure 6.
Identification of lipid metabolism-associated changes in serum and liver after Scenedesmus feeding. (A) Hepatic carnitine-related metabolites. (B) Hepatic gene expression levels of PPARα-targeted genes. The control is artificially set as 1. (C) Hierarchal cluster analysis (HCA)-based heat map on the clustering of Scenedesmus-responsive phospholipids (PL) in serum based on their relative abundances. (D) HCA-based heat map on the clustering of Scenedesmus-responsive PL in the liver based on their relative abundances. (E) Choline in the liver. F. Expression level of Pemt gene in the liver. P-values indicate overall significances across all sample groups from the one-way ANOVA test. Means with different letter labels (a,b) indicate significant differences (P < 0.05) between two dietary treatments by the Tukey post hoc test.

