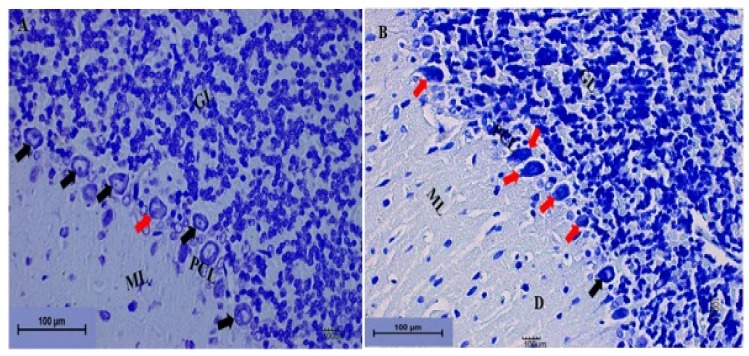
Figure 8.
Photomicrograph sections of the cerebellums from the rat groups. (A) Control showing the molecular layer (ML), the granular layer (GL), and the Purkinje cell layer (PCL). The Purkinje cells are shown by the black arrow, with prominent nuclei. (B) LTG showing the molecular layer (ML) with a degenerated area of cells (D) and Purkinje cells with darkly stained cytoplasm and distorted nuclei leaving spaces between them (red arrow). The granular layer (GL) indicates deeply stained cells with vacuolation (toluidine blue 200×, scale bar = 100 µm).

