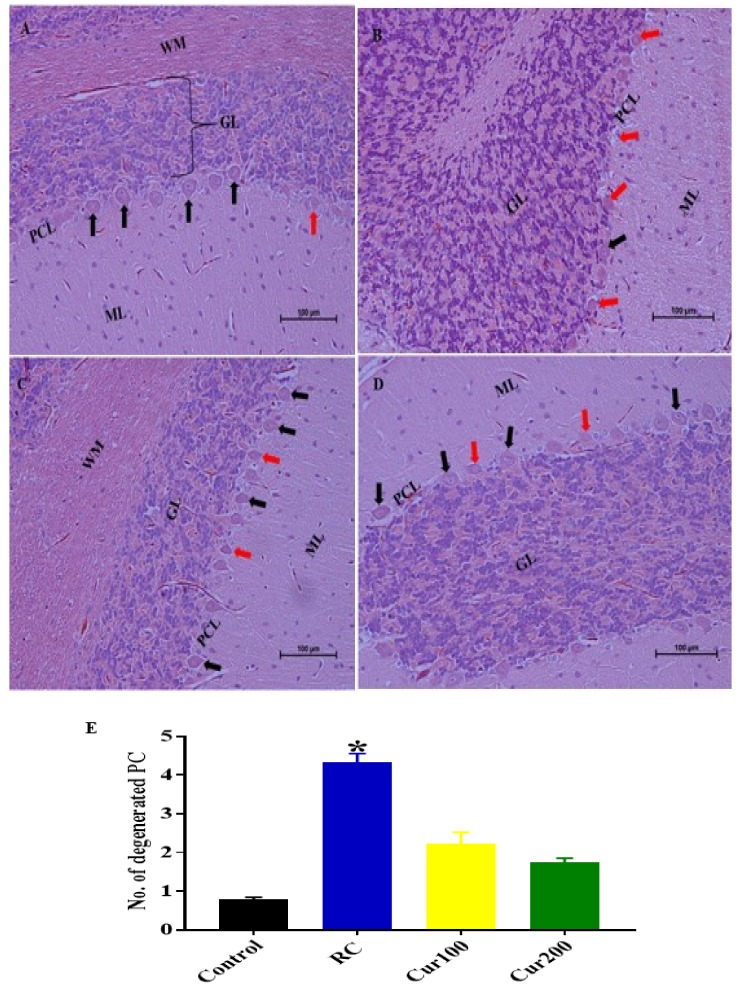
Figure 15.
Photomicrograph sections of the cerebellums of the rat groups. (A) Control group indicating layers of the cerebellar cortex, the molecular layer (ML) with glial cells, the middle Purkinje cell layer (PCL) with the Purkinje cells having a large pyriform shape (black arrow), white matter (WM), and the inner granular layer with aggregation of granular cells (GL). (B) RC showing eosinophilic Purkinje cells with irregular dark cytoplasm (red arrow) and scattered glial cells in the molecular layer (ML). (C) Cur100 showing the Purkinje cells with prominent nuclei and a regular shape (black arrow); the molecular and granular layers appear normal. (D) Cur200 showing normal pyriform-shaped Purkinje cells with prominent nuclei (black arrow) and normal granular and molecular layers. (E) Semi-quantitative representation of degenerated Purkinje cells in different rat groups. Data are represented as mean ± SEM (n = 3); * p < 0.005 vs. control. H and E 200×, scale bar = 100 µm.

