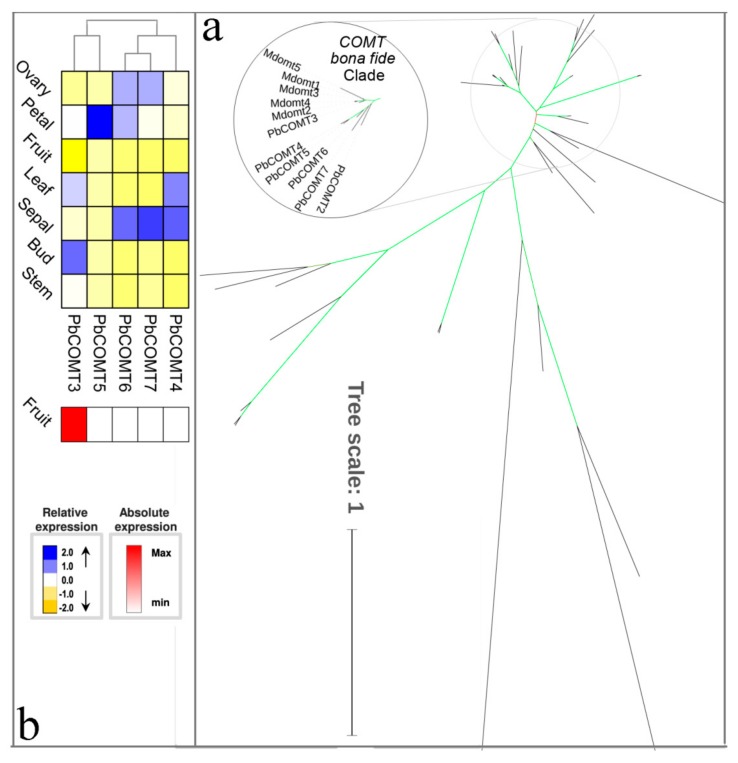
Figure 9.
Phylogenetic tree and expression profiles of the COMT bona fide clade. (a) ML tree built with COMT bona fide enzymes from several species. (b) The expression profiles P. bretschneideri COMT bona fide genes. Subclade containing the bona fide genes is highlighted. The green color of the tree branches suggests strong node support (bootstrap support ≥ 95% and SH-aLRT ≥ 75%). The FPKM values of PbCOMT genes in different tissues are indicated in Table S3. The gene accession number is indicated in Table S4, Figure S4. The tree scale is the number of amino acid substitution per site.

