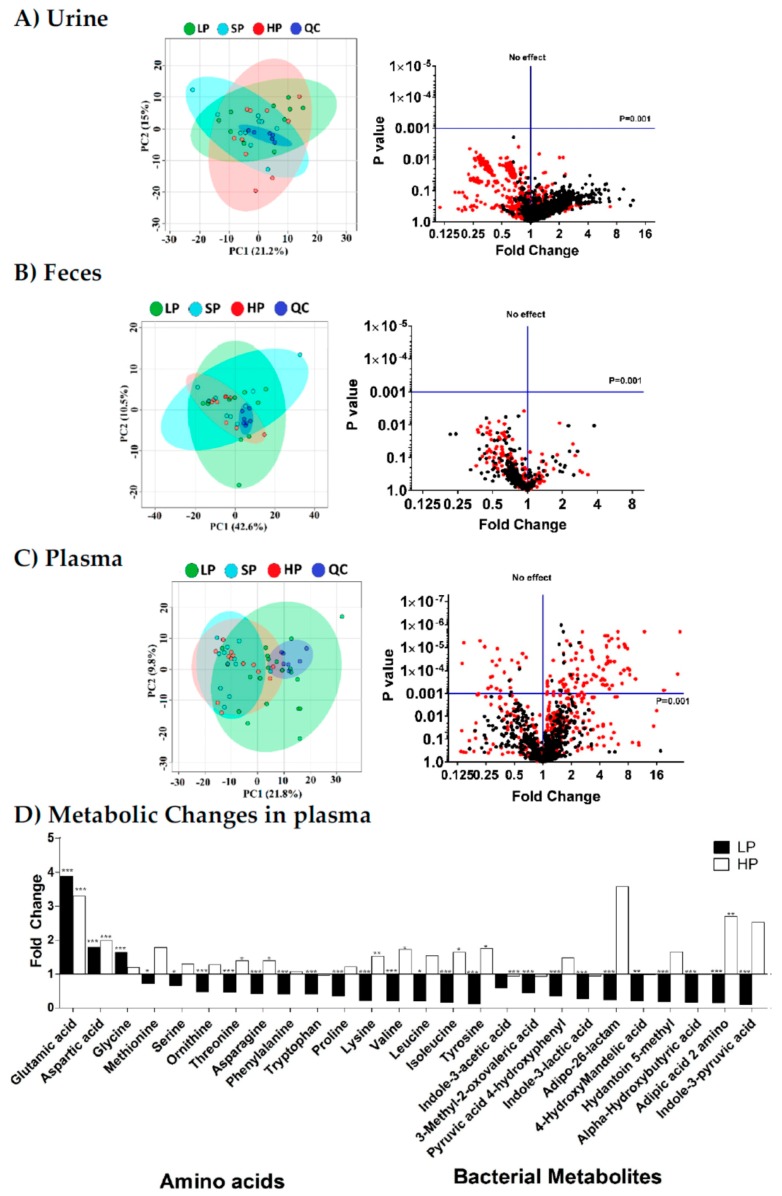
Figure 1.
Metabolomic profiles of (A) urine, (B) faeces, and (C) plasma samples of wt mice on diets with low (LP—green), standard (SP—light blue), or high (HP—red) protein content (panels on the left). To synchronize the nutritional states of the mice, plasma samples were collected in the re-fed state, i.e., mice held for 14 days on the specified diet were fasted for 6 h and then re-fed with the same diet for 1 h before sample collection. Using standard settings, principal component analysis (PCA) could not discriminate between the three conditions. The quality control (QC) (dark blue) samples appear as tight clusters. The panels on the right side show the volcano plots constructed from all mass features in which the x-axis represents fold-change and the y-axis represents significance (p-value). The plot shows the log-converted fold-change of metabolites between the LP and SP groups as red dots and between the HP and SP groups as black dots in (A) urine, (B) faeces, and (C) plasma samples of wt mice. The horizontal blue line represents the statistical significance cutoff, and the vertical blue line represents no change. (D) Amino acid and bacterial metabolite changes in plasma. Fold-changes in LP (black) and HP (white) groups are compared to the SP group. Statistical significance is presented as follows: * for p-values between 0.05 and 0.01; ** for p-values between 0.01 and 0.001; *** for p-values <0.001 (n = 10 per group).

