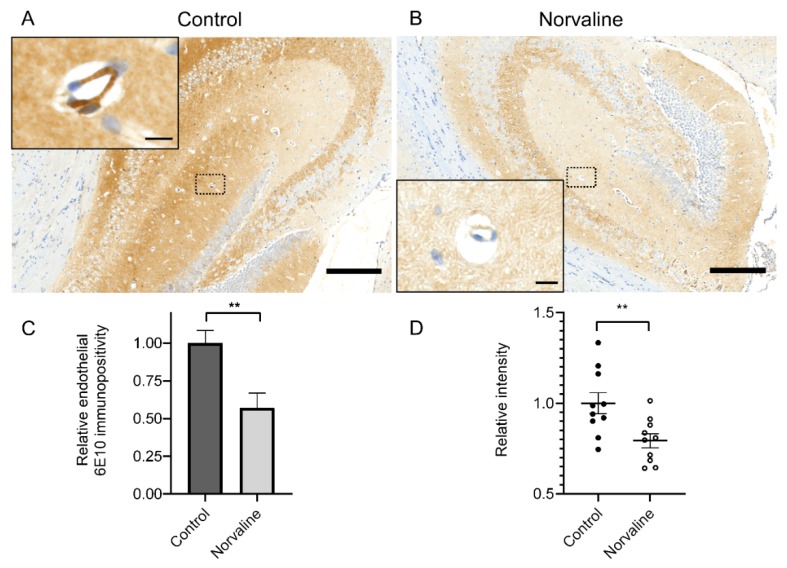
Figure 3.
Cerebral amyloid angiopathy (CAA) in 3×Tg-AD mice revealed by 6E10 staining. (A) Representative × 40 photomicrograph demonstrating extensive 6E10 immunopositivity in the hippocampus of vehicle-treated seven-month-old mice (scale bar = 200 µm). (B) Representative × 40 photomicrograph with significantly reduced 6E10 immunopositivity in the hippocampus of L-norvaline treated mice (scale bar = 200 µm). Insets show hippocampal penetrating microvessels with the illustrative morphology at higher magnification (scale bar = 10 µm). (C) Quantification of the relative Aβ burden with ZEN 2.5 (6E10 immunopositive surface area) in the microvessels of control and norvaline-treated 3×Tg-AD mice. (D) Quantification of the relative stain intensity with ImageJ (n = 10, five mice for each group, two sections per mouse, one vessel per section, mean ± SEM, Student’s t-test, ** p < 0.01).

