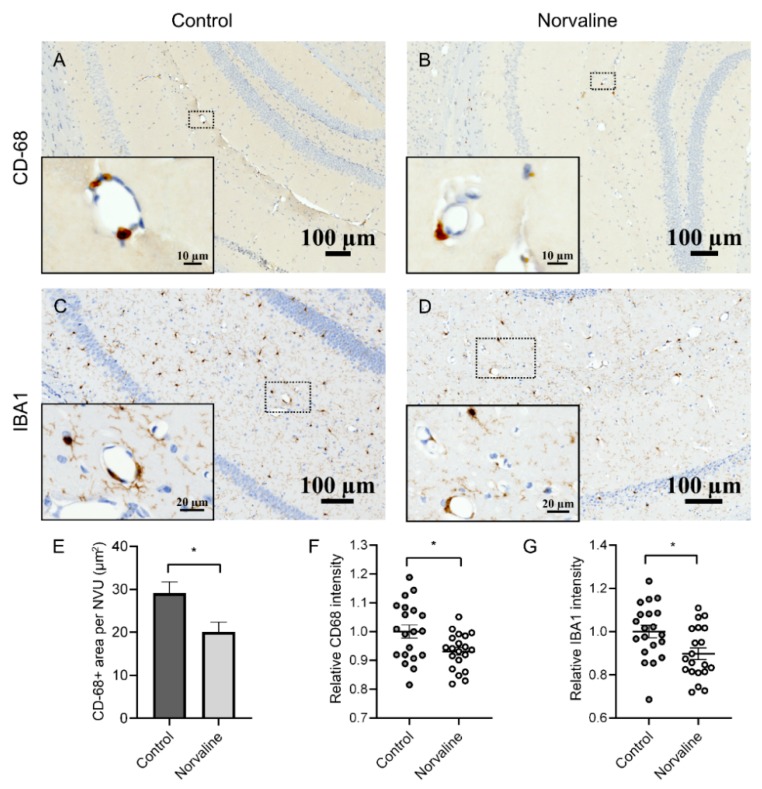
Figure 6.
Microglia infiltrate 3×Tg-AD mice brains in a perivascular fashion. Representative hippocampal bright-field × 40 micrographs with × 100 insets. Perivascular infiltration with CD-68+ cells of control (A) and norvaline-treated mice (B) hippocampi. Iba1+ microglia in control (C) and norvaline-treated (D) mice. Measurement of the CD-68 immunopositive surface area (E) and stain intensity (F) with ZEN 2.5 revealed a significant effect of the treatment. (G) The relative intensity of perivascular Iba1+ microglia. Student’s unpaired t-test, n = 20, * p < 0.05.

