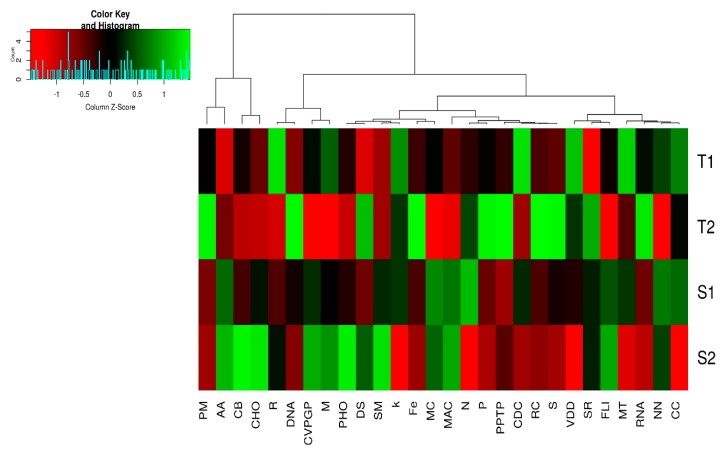
Figure 2.
Sequences similar to major metabolisms in termite mound soils and the surrounding soil samples. The scale bar represents color saturation gradient based on the relative abundances with z-score transformed relative abundance of the functional gene categories. Abbreviations are as indicated in the text above.

