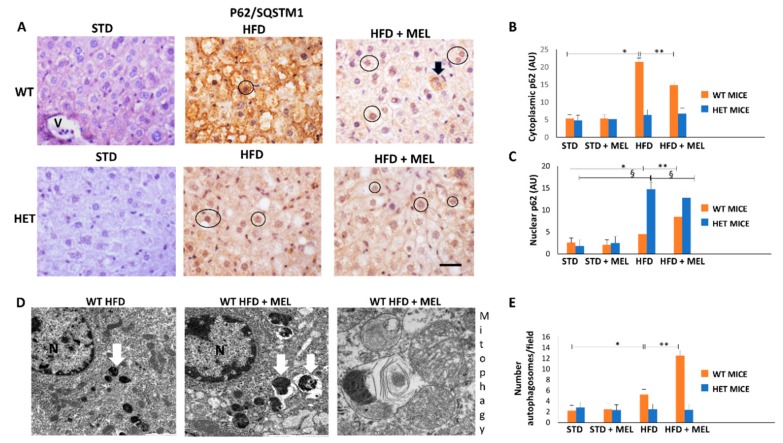
Figure 5.
Melatonin recovered autophagy in the liver of wild type (WT) but not in SIRT1 heterozygous (HET) mice on a high-fat diet. (A) Representative pictures of P62/SQSTM1 immunohistochemistry in the liver. (B,C) Densitometric analysis of cytoplasmic and nuclear P62/SQSTM1 immunostaining. (D) Representative transmission electron micrographs of WT mice liver plus melatonin, indicating autophagy and mitophagy. (E) The quantification of autophagosomes. Scale bars in immunohistochemistry represent 10 µm. Black circle, P62-positive nucleus, White arrow: late autophagosome. Values are mean ± SEM. * p < 0.05 vs. WT STD, § p < 0.05 vs. HET STD, ** p < 0.05 vs. WT HFD.

