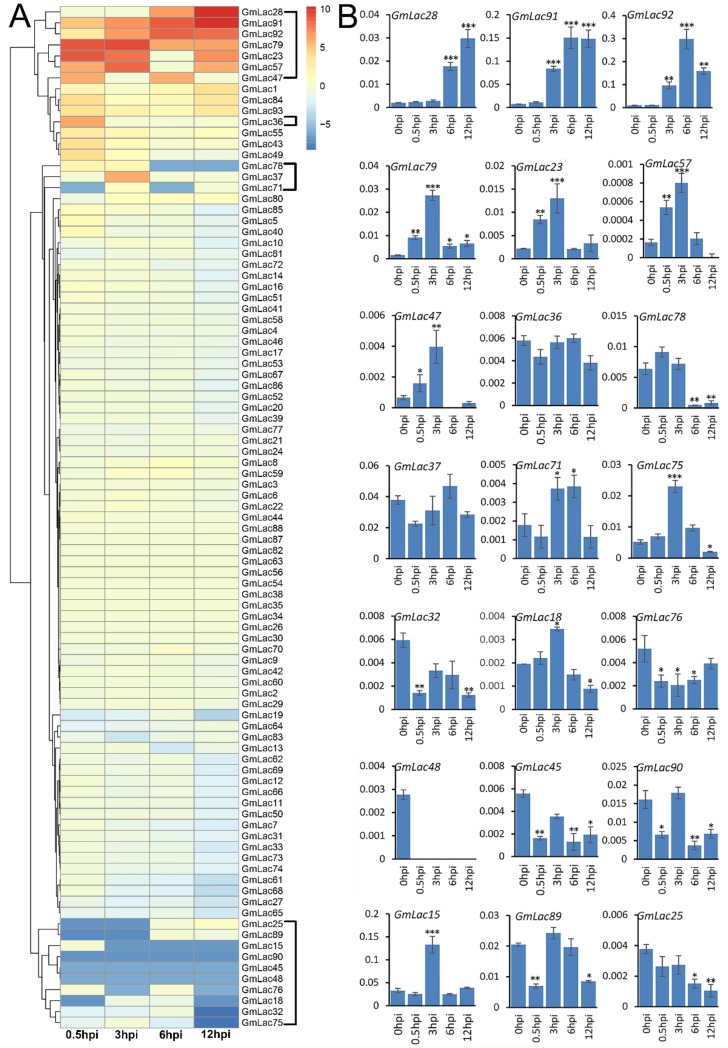
Figure 5.
Expression profiles of the 93 soybean laccase genes following Phytophthora sojae infection. (A) Transcriptome heatmap. The hierarchical cluster color code: the highest induction values vs. controls are displayed in red (hot), while the values displayed in blue (cool) indicate the most reduced expression levels vs. controls; intermediate expression levels are represented by lighter intermediate colors. The color scale represents △FPKM normalized to log2-transformed vales. The genes marked by the black brackets on the right in (A) are those obviously mis-regulated genes. (B) Expression levels of 21 GmLacs after P7076 infection. Bars represent average values of three replicates ± standard deviation (SD). All expression levels of the GmLac genes were normalized to the expression levels of GmPDF. ***, **, and * indicate significant differences compared to the control (0 h) at p < 0.001, p < 0.01, and p < 0.05, respectively.

