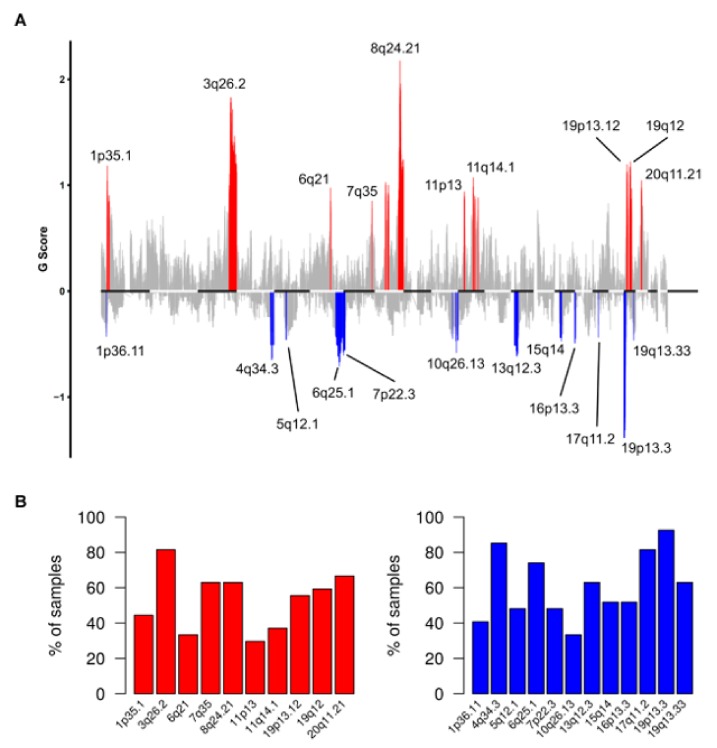
Figure 4.
Recurrent somatic copy number alterations (sCNA) in R0 patients of TCGA-OV27 cohort. (A) Plot of G scores (defined as the amplitude of the copy number multiplied by its frequency across samples) calculated by Genomic Identification of Significant Targets in Cancer (GISTIC) for genomic regions recurrently amplified (red) or deleted (blue) in the TCGA-OV27 dataset, at an FDR < 0.1. (B) Barplot showing the frequency of samples positive for the recurrently amplified (left) or deleted (right) regions identified by GISTIC.

