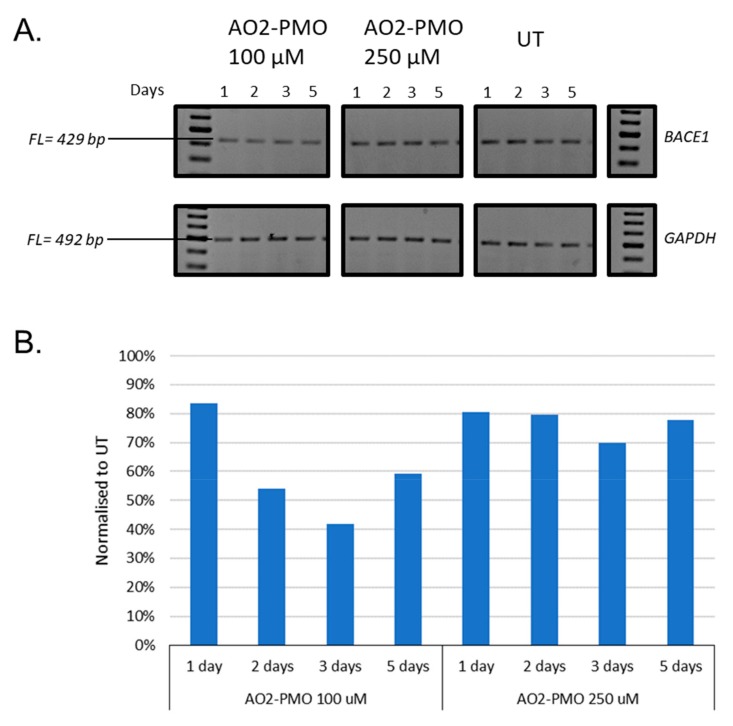
Figure 5.
(A) Representative RT-PCR analysis of the BACE1 and GAPDH transcripts after treatment with AO2-PMO targeting exon 2 for 1, 2, 3, and 5 days at 100 µM and 250 µM inHEK293 cells. FL, full-length; UT, untreated; SCR, scrambled sequence; GAPDH was used as a loading control. The gel images were cropped to highlight the BACE1 specific products and the corresponding house-keeping gene control GAPDH. The original images are shown in Figure S5 (Supplementary Information). (B) Densitometry analysis of BACE1 transcript downregulation in HEK293 cells in vitro.

