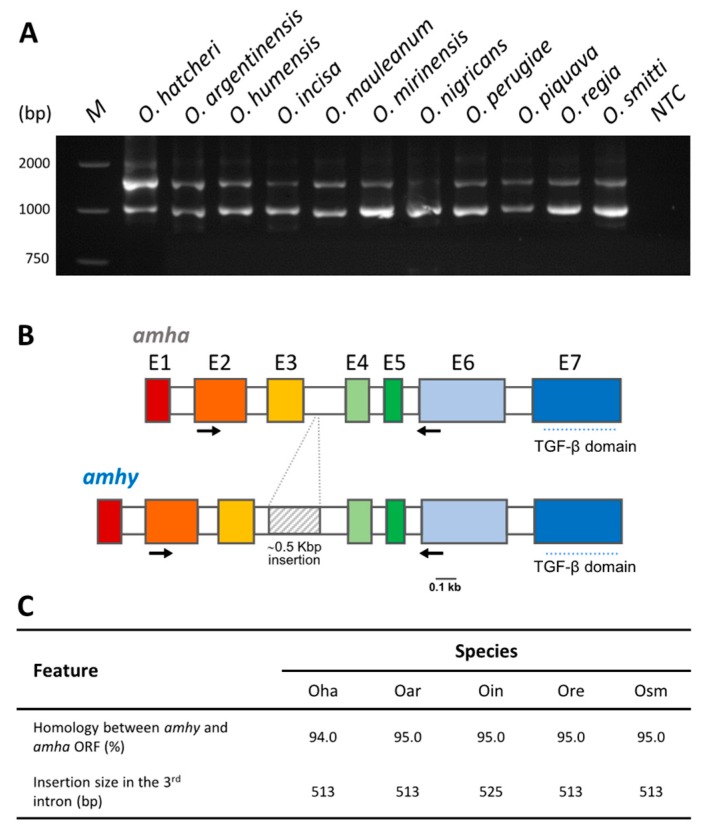
Figure 2.
amhy gene amplification pattern, gene structure, and nucleotide sequence comparison Odontesthes species. (A) Pattern of amhy (upper band) and amha (lower band) amplification using primers flanking the third intron in presumable genotypic males. M: molecular weight marker; NTC: non-template control. (B) Schematic representation of amhy and amha gene structure in the four key Odontesthes species. Exons (E1 to E7) are represented by colored boxes and introns by open boxes; corresponding exons of each locus are represented by the same color. The gray box represents the insertion in the third intron. Arrows indicate the position of primers used in (A). (C) Nucleotide identity comparison of predicted amha and amhy Open reading frames and the size of insertion in the third intron. Oha: Odontesthes hatcheri; Oar: O. argentinensis; Oin: O. incisa; Ore: O. regia; Osm: O. smitti.

