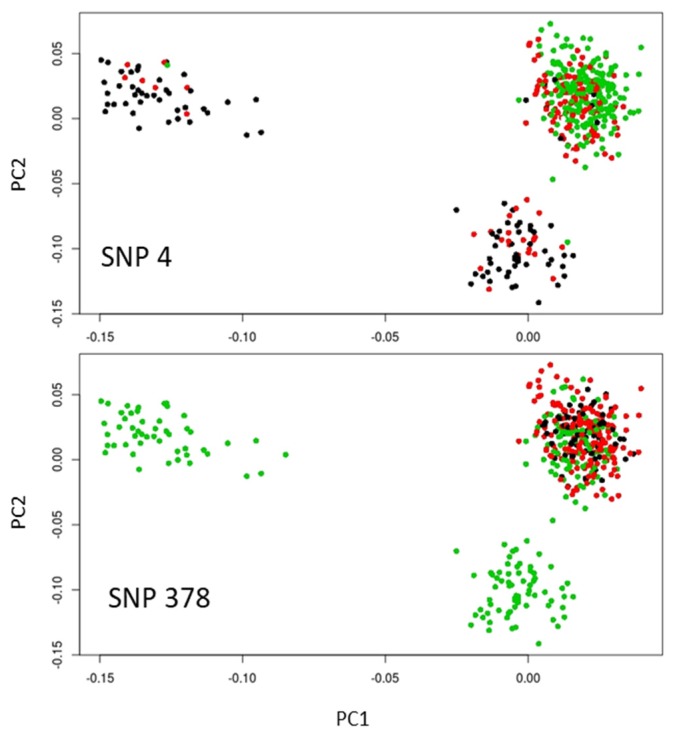
Figure 4.
Highlights on the score plot for the two main SNP outliers common to the outlier methods based on the XtX statistics (Bayenv2 and Baypass) and PCA (PCAdapt). Homozygotes for allele 1 and 2 are in green and black, respectively, while heterozygotes are in red. The populations are the same as in Figure 1c.

