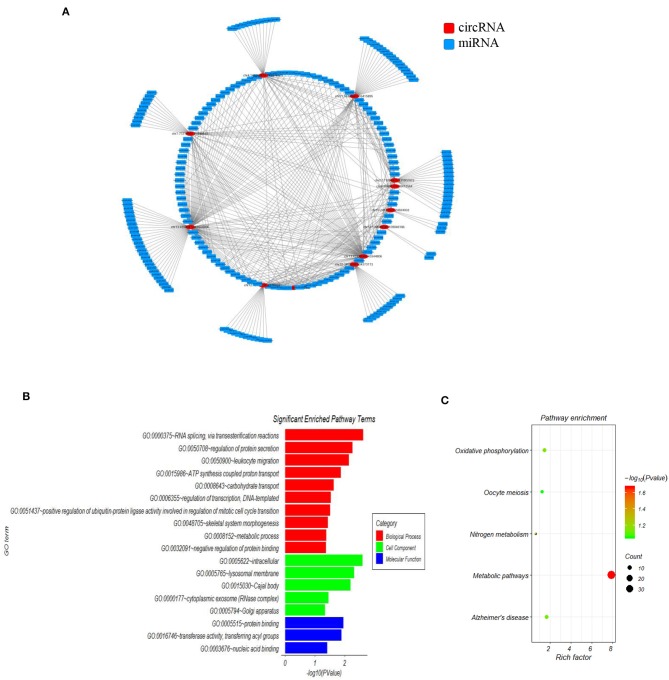
Figure 2.
The mapping network of circRNA-miRNA interactions in SLE. (A) The network map includes the 12 surviving candidates from the 15 significantly altered circRNAs (represented as red nodes) in the analysis for circRNA-miRNA network prediction. The other three differentially expressed circRNAs did not show reliable results in this interaction analysis. The blue nodes around the red node were the predicted miRNAs that interacted with the related circRNAs. (B) Gene ontology (GO) analysis for 12 circRNA-interacting miRNAs and their target genes showing significantly enriched pathways. Red indicates biological process (BP), green indicates molecular function (MF), and blue indicates cellular component (CC). (C) KEGG Pathway analysis for 12 circRNA-interacting miRNAs and their target genes showing significantly enriched signaling pathways. The Y-axis indicates pathway name, and the X-axis indicates the richness factor. The size of the spots represents the number of enriched differential target genes, and change of color from green to red represents the Q-value.

