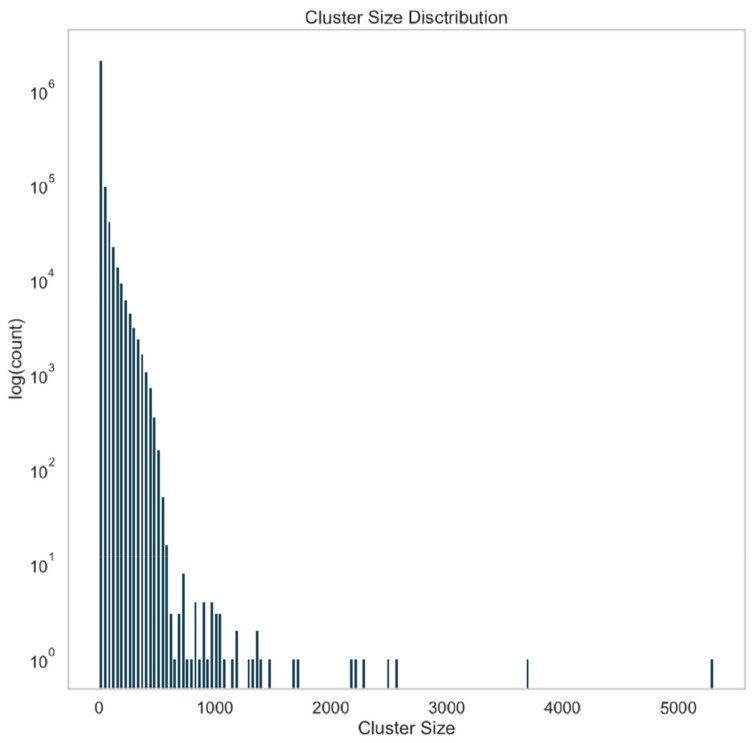
Figure 3.
Abundance of contig clusters by cluster size. All of the contigs with length greater than 1 kb were combined with the RefSeq viral data set. An all-vs.-all comparison was made via BLASTN. BLAST hits were treated as edges in a graph with a weight equal to the log transform of the E-value, and this graph was clustered using Markov clustering. The resulting clusters were then analyzed for size, and a histogram of cluster size is shown. Approximately half of the clusters are singletons.

