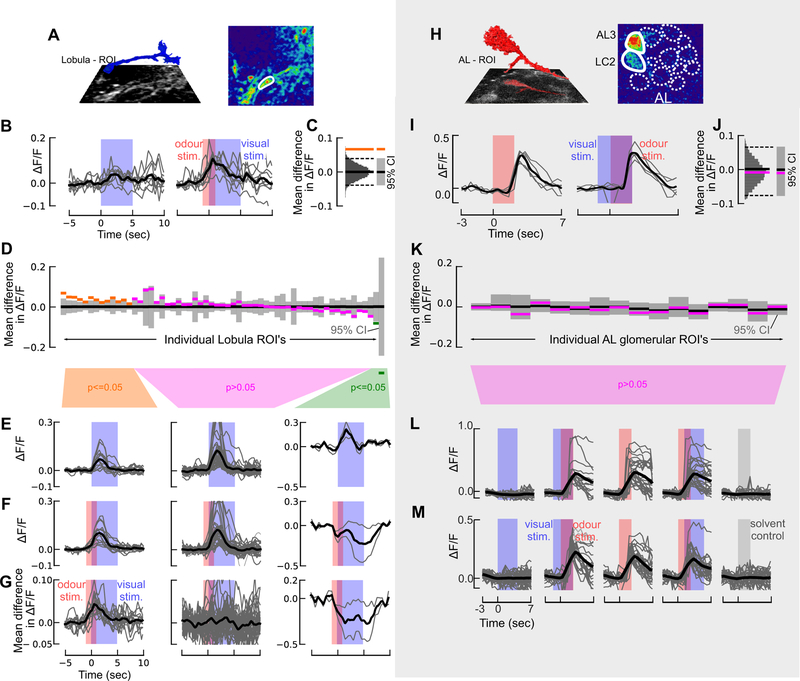
Figure 3. Calcium imaging of visual responses in the mosquito antennal and optic lobes reveals asymmetric neuromodulatory effect of odour.
(A) 3D reconstruction of a lobula ROI inset above the imaging plane (left). (Right) pseudocolour plot of the calcium fluorescence during the presentation of a visual stimulus.
(B) Time series of ΔF/F in one ROI for 9 presentations of the visual stimulus (bar) without an odour stimulus (left)(the visual stimulus is represented by the blue shading); and with an odour stimulus preceding and overlapping the visual stimulus (right)(CO2 stimulus is represented by the red shading). The maroon shading represents the time when the visual and odour stimuli overlap.
(C) To assess the difference in the response for the odour and no-odour experiments, we calculated the difference in the mean ΔF/F during the visual stimulus period for the two experiments (orange line). We then generated a null distribution by pooling the data from both experiments and bootstrapping 10,000 pairwise differences from this combined dataset (gray histogram). If the actual difference lies outside of 95% confidence interval (CI) of this bootstrapped distribution (dashed lines), the difference is significant (p<=0.05; depicted by orange line).
(D) As in C, but for the 59 lobula ROIs where the difference in mean ΔF/F for the odour and no odour case, calculated as in C. The results are plotted as in Figure 3, and the ROI’s in this figure are sorted in the same order shown in Figure 3, allowing for a direct comparison.
(E) ΔF/F time traces for the “no odour” visual stimulus, split into the three statistical groups shown in D. Thin traces show the average response for each ROI across 9 trials. Time course of the visual stimulus is represented by the blue shading.
(F) ΔF/F time trace for odour+visual stimulus experiments, as in E. Blue and red bars denote the visual and CO2 stimuli, respectively.
(G) Difference in the mean ΔF/F time traces shown in E and F for each ROI. Blue and red bars denote the visual and CO2 stimuli, respectively.
(H) 3D reconstruction of the AL3 projection neuron (red) above the imaging plane (left), and (right) pseudocolour plot of the Ae. aegypti AL at the 30μm imaging depth. AL glomeruli are depicted by dashed lines; the nonanal-responsive AL3 and LC2 glomeruli are depicted by the white solid lines.
(I) Time series of ΔF/F in one ROI for 5 odour stimulations without a visual stimulus (left; red shaded bar) and with a visual stimulus preceding the odour stimulus (right; blue bar represents the time course of the visual stimulus).
(J) As in C, but for the AL3 glomerulus in I.
(K) Difference in mean ΔF/F for the odour and odour+vision case for each of the 16 glomerular ROI’s, calculated as in C.
(L) ΔF/F time traces for the AL3 glomerulus in the different treatments: visual presentation alone (blue bar); visual presentation preceding the odour; odour alone (red bar); odour stimulus preceding the visual presentation; and no odour (mineral oil) control (grey bar). Thick trace (black) is the mean from 8 mosquitoes; thin grey traces are the individual stimulations across all animals (n=4 or 5 per mosquito).
(M) As in L, but for the LC2 glomerulus.

