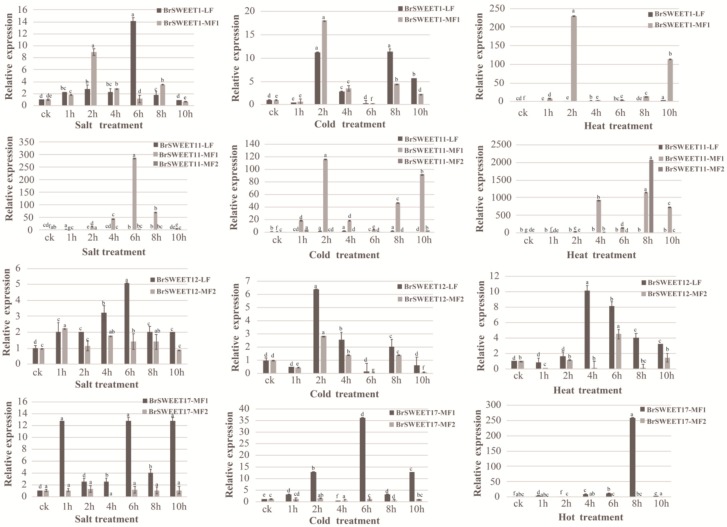
Figure 5.
Expression patterns of co-orthologs of SWEETs under salt, cold, and heat stress treatments in B. rapa by RT-qPCR. Error bars represent ± SE (n = 3). The one-way analysis of variance was calculated by Duncan’s new multiple range test, n = 3; different letters above the bars indicate significant differences (p < 0.05).

