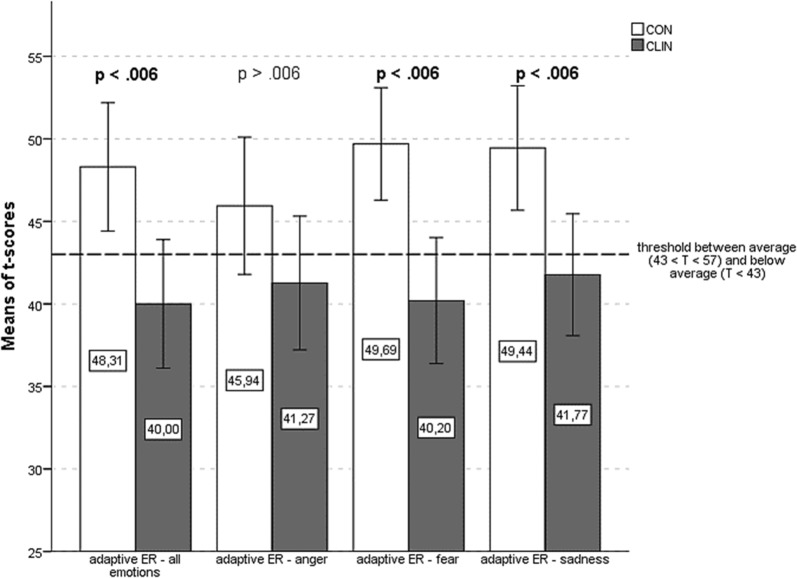
Fig. 1.
Adaptive ER. Means of adaptive ER over all emotions and for each emotion (anger, fear, sadness) separately for both groups (CLIN and CON) with error bars marking the 95% CI. Applying Bonferroni-correction the level of significance was set at α = .006. Significant differences are highlighted. The threshold between the average range and the below-average range is marked by a horizontal line at T = 43

