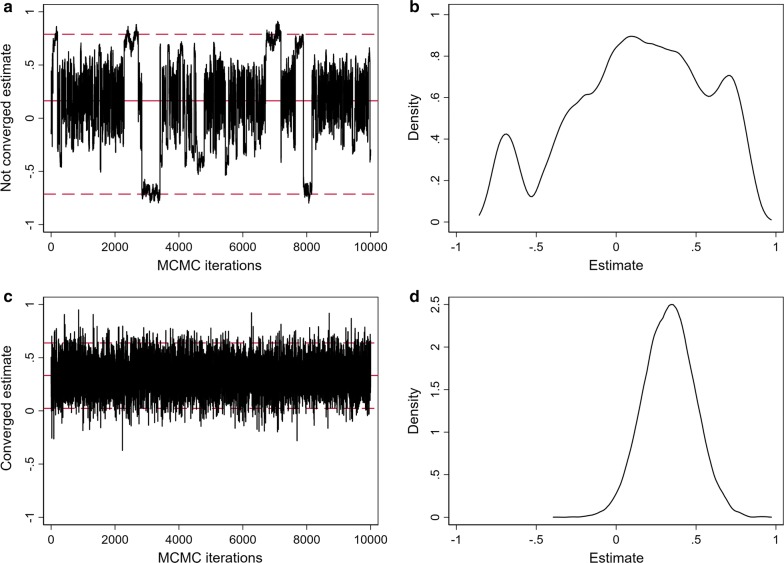
Fig. 1.
Example trace and density plots used to assess convergence of the MCMC chains for the log-SIR for two selected SA2s: a trace plot and b density plot for a model run on simulated data showing an example of lack of convergence; and c trace plot and d density plot for the Leroux incidence model for one selected cancer and SA2, showing convergence of the estimates used in the Atlas

