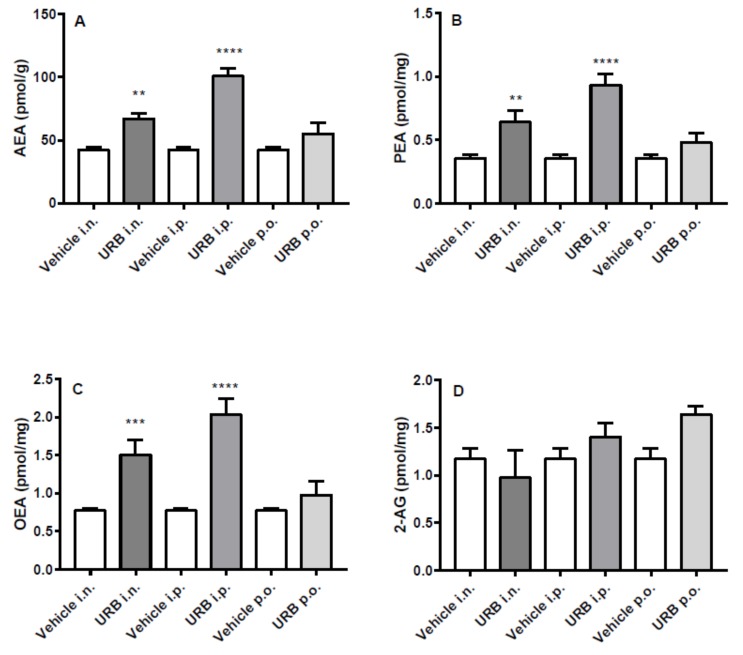
Figure 4.
Effect of in vivo URB administration on cortical levels of NAEs and 2-AG. Levels of (A) AEA, (B) PEA, (C) OEA and (D) 2-AG following URB or vehicle (i.n., i.p. or p.o.) administration. Data are presented as mean ± SEM expressed as pmol per gram or milligram of wet tissue. ** p < 0.01, *** p < 0.001 and **** p < 0.0001 post hoc comparisons with vehicle conditions, Tukey’s test.

