Figure 2.
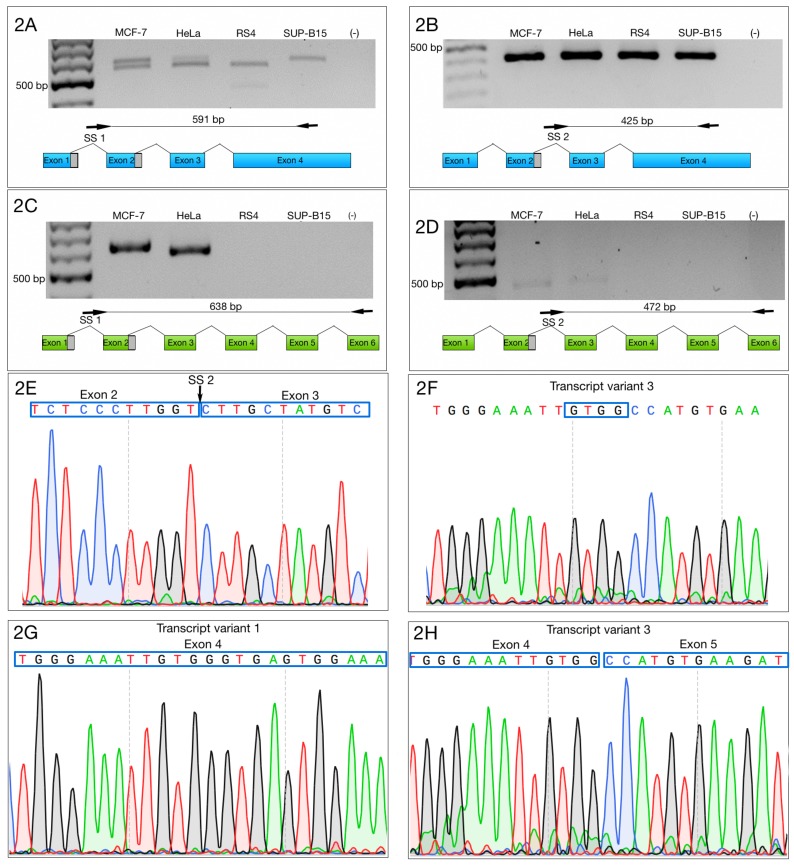
Selective amplification of ZNF695 alternative transcript variants. We selectively amplified the transcript variants of ZNF695. The black arrow and the black line indicate the sites of amplification and the PCR product size, respectively. The blue box indicates the full length of the long transcript of ZNF695 (TV1), the green box represents the short transcript of ZNF695 (TV3) and the grey box indicates the spliced region in the transcript. (A) Amplification of ZNF695_TV4 (591 bp) and ZNF695_TV5 (561 bp), which were co-expressed in the MCF-7 and HeLa cell lines. We observed that RS4 and SUP-B15 only expressed one variant, TV5 and TV4, respectively. (B) Specific amplification of ZNF695_TV5 of 425 bp in the four cell lines. (C) Amplification of ZNF695_TV6 (638 bp) in the MCF-7 and apparently HeLa cell lines expressed a preference for a TV7 of 608 pb. (D) Expression of ZNF695_TV7 (472 bp) was low in the MCF-7 and HeLa cell lines. We observed that in the HeLa cell line the amplified fragment showed bigger size than MCF-7. However, the sequences obtained from both fragments showed no difference. (E) Sequence of SS2 of the amplified ZNF695 transcript variants. The blue boxes show the boundary (exon 2–3) of the AS site. (F) Sequence that confirms the identity of ZNF695_TV3. (G) Partial sequence that confirms the identity of ZNF695_TV1 (NM_020394.5). (H) Partial sequence that confirms the identity of ZNF695_TV3 (NR_037892.1).

