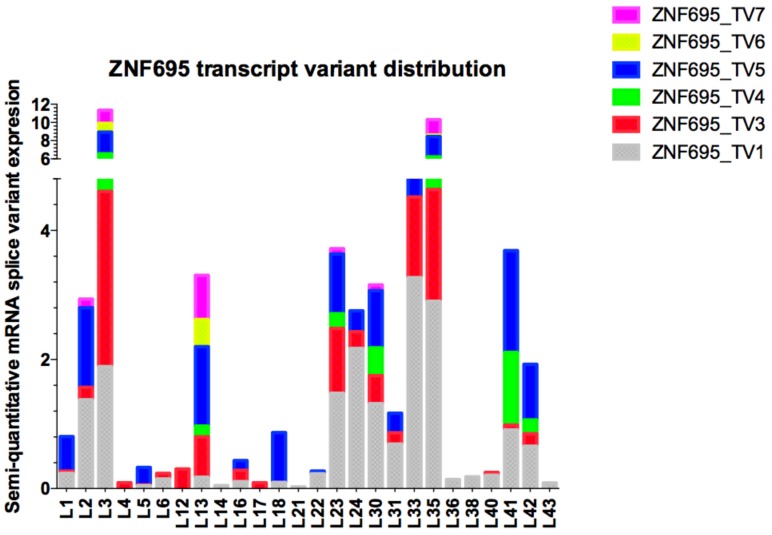
Figure 7.
Semi-quantitative expression analysis of ZNF695 transcript variants expressed in B-ALL. The plot shows the diversity in the expression and co-expression of ZNF695 alternative splice variants in B-ALL. The color bars represent the ZNF695 transcript variants: gray bars indicate ZNF695_TV1, red bars indicate ZNF695_TV3, green bars indicate ZNF695_TV4, blue bars indicate ZNF695_TV5, yellow bars indicate ZNF695_TV6, and pink bars indicate ZNF695_TV7 expression.

