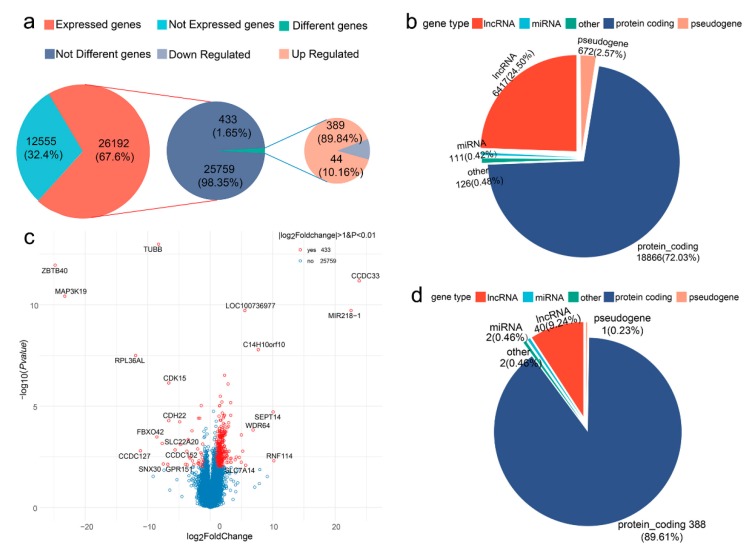
Figure 2.
Counting and classification of differentially expressed genes (DEGs). (a,b) The pie chart displays the DEGs distribution among protein coding genes, long non-coding RNA (lncRNA), pseudogene, microRNA (miRNA), and other gene types. (c) Volcano plot of the DE genes with |log2(FoldChange)| > 1 and adjusted p-value < 0.01. The log2 Fold Change on the x-axis signifies expression difference, while the −log10 (p-value) on the y-axis indicates the significance of each gene. Red dots represent the 433 DE genes. Blue dots represent the remaining detected genes that did not meet the determined criteria. Dots with gene name annotations signify the 20 most significant DE genes. (d) The pie chart displays the distribution of 433 DE genes among protein coding genes, lncRNA, pseudogene, miRNA, and other gene types.

