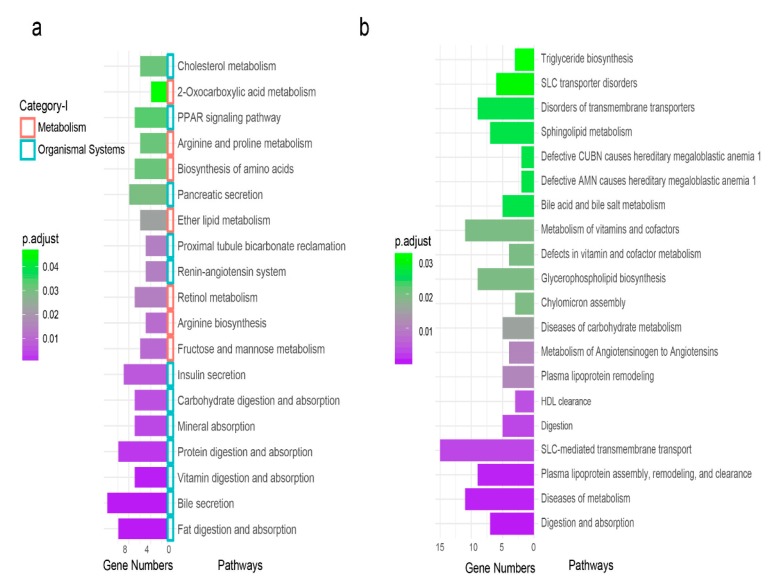
Figure 4.
Pathway analyses of the DE genes. (a) Enriched pathways of the DE genes in the Kyoto Encyclopedia of Genes and Genomes (KEGG) pathway database. The vertical coordinates are the enriched pathways, and the horizontal coordinates are the number of DE genes in each enriched pathway. The color of the bar represents the adjusted p-value, while the small squares represent the pathway’s primary category. (b) Enriched pathways of the DE genes in the ReactomePA pathway database. The vertical coordinates are the enriched pathways, and the horizontal coordinates are the number of DE genes in each enriched pathway. The color of the bar represents the adjusted p-value.

