
Fig. 3.
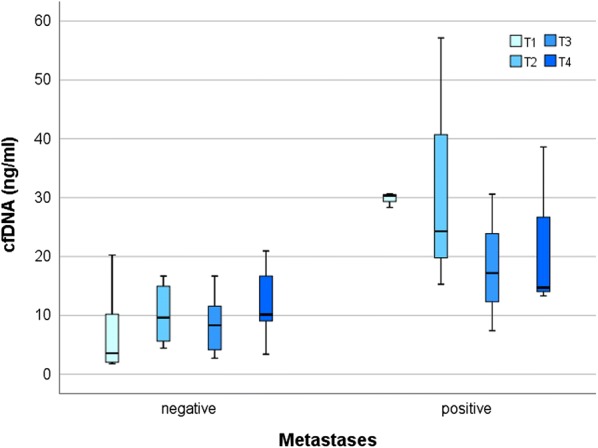
cfDNA concentrations at different time points and presence of metastases. The analysis shows that patients presenting metastases when recruited in the trial, had still a significant higher amount of plasmatic cfDNA in the timeframe between micro-interventional therapy and the beginning of sorafenib-based systemic therapy (T1, p = 0.012). Borderline significance (p = 0.073) was found after the beginning of systemic therapy (T2), while no significant difference was found at the two later time points. Comparison was performed using the Mann–Whitney U test (* ≤ 0.05)