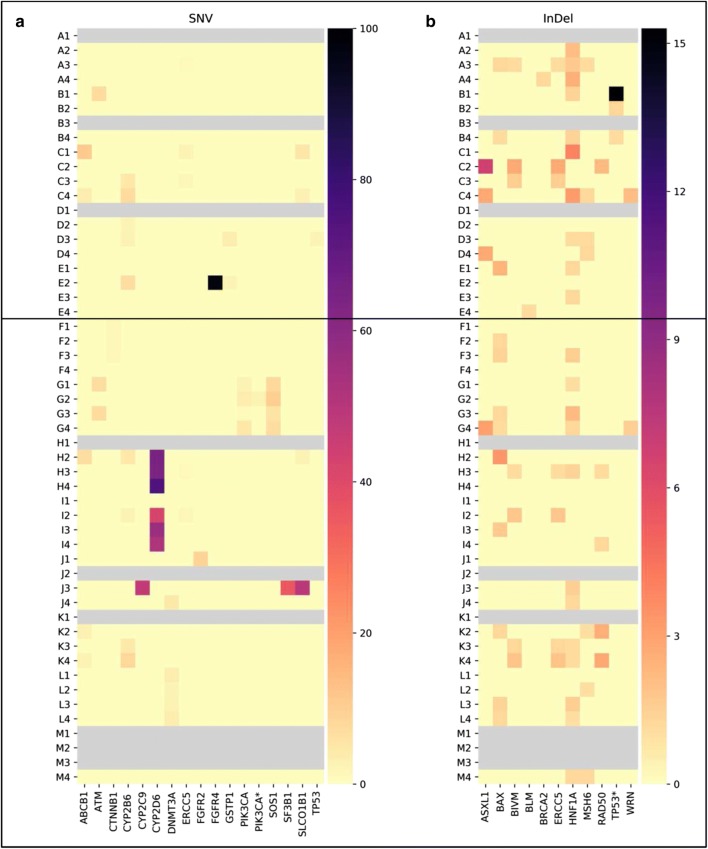
Fig. 6.
Heatmaps showing the variants discovered in the two subgroups of patients (A–E: below 65, no liver cirrhosis, no past alcohol abuse and better response to therapies; F–M: over 65, with liver cirrhosis, past alcohol abuse and worse response to therapies) at the different time points. In (a) and in (b) SNV and InDel with relative mutation frequencies are reported, respectively

