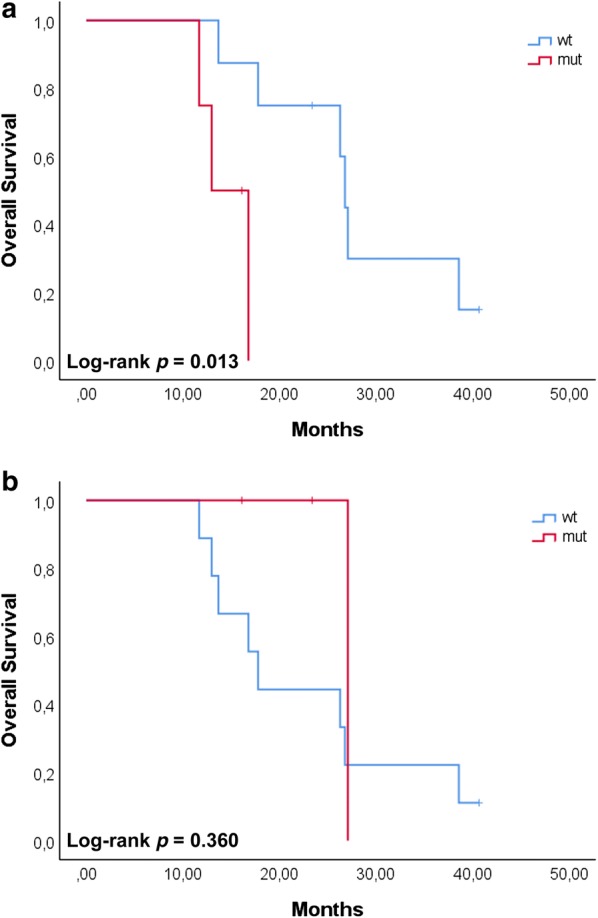
Fig. 7.

Survival plots for HCC patients carrying the CP2B6 variant. Patients were grouped according to the time points (T1–T2, a; T3–T4, b). Patients carrying the variant at T1–T2, showed a worse survival with respect to those patients carrying the variant at T3–T4. OS was analyzed using the Kaplan–Meier method and survival estimates in the different groups were compared using the log-rank test
