Figure 1.

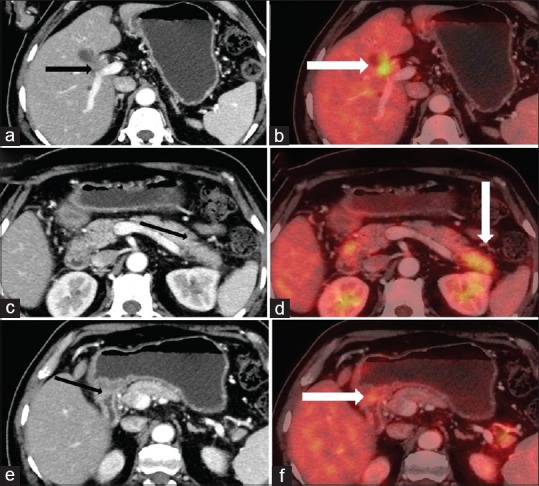
Computed tomography and positron emission tomography/computed tomography images showing cholangitis (a and b), pancreatitis (c and d), and gastritis (e and f)

Computed tomography and positron emission tomography/computed tomography images showing cholangitis (a and b), pancreatitis (c and d), and gastritis (e and f)