
Figure 2.
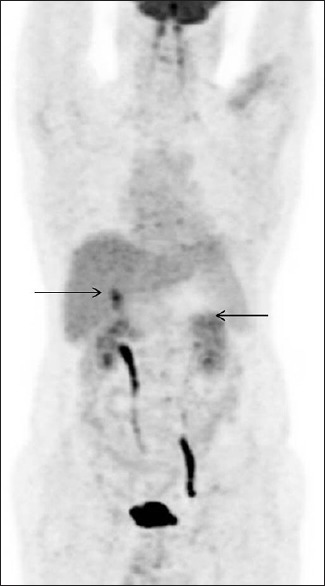
Maximum intensity projection image showing increased fluorodeoxyglucose uptake in the common bile duct and distal pancreas
Official websites use .gov
A
.gov website belongs to an official
government organization in the United States.
Secure .gov websites use HTTPS
A lock (
) or https:// means you've safely
connected to the .gov website. Share sensitive
information only on official, secure websites.
Maximum intensity projection image showing increased fluorodeoxyglucose uptake in the common bile duct and distal pancreas