Figure 3.
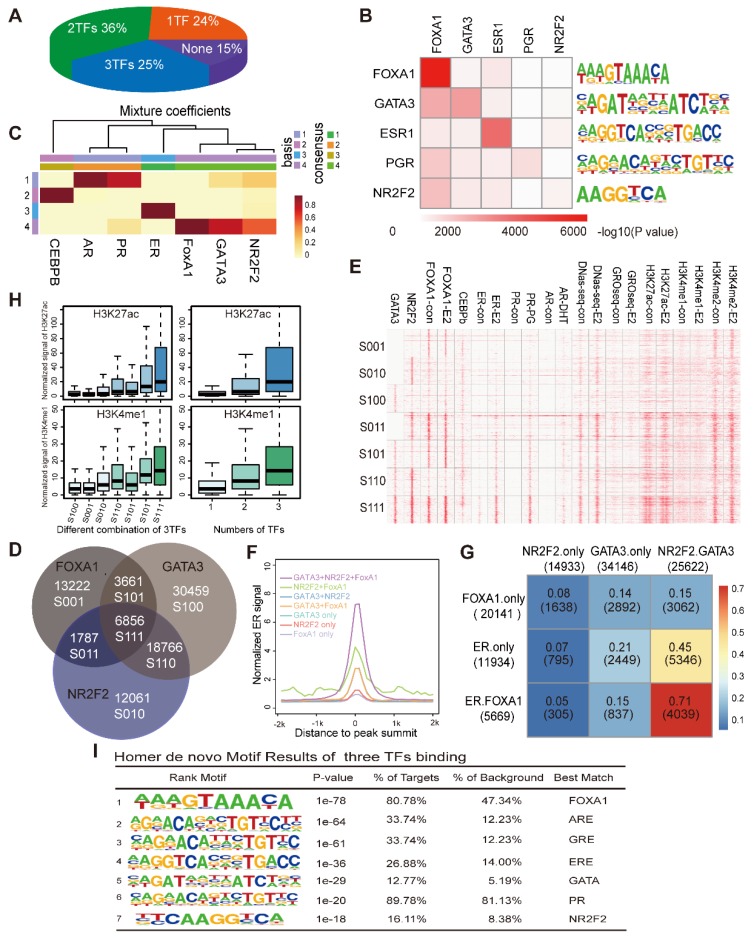
NR2F2, GATA3 and FOXA1 associate with open chromatin that contains ER motifs. (A) The proportion of ERα binding sites co-localized by the numbers of PFs (NR2F2, GATA3, and FOXA1) from one to three. (B) Motif enrichment of each transcription factor binding site. Rows show the -log10(p-value) of the motif enrichment level of the TFs labelled in the corresponding column using the TF binding sites in the row scanned with Homer. (C) The heatmaps visualize the NMF coefficient matrix for the binding signals of the top few transcription factors. The columns show the clustered complexes, and the rows show the coefficient weights of the corresponding TFs for each complex. (D) Venn diagram demonstrating the overlap of the ChIP-seq FOXA1 binding patterns with the NR2F2 and GATA3 binding patterns. Each group identified has been notated with the corresponding label and the number of overlapping binding sites. (E) Heatmap representing the binding intensity of the corresponding factors in the column, with the specific binding groups characterized by the Venn diagram and labelled with lowercase letters. The heatmap is presented as the number of reads per kilobase per million mapped reads across the position of the reads in a 2 kb region flanking the centre of the peak. (F) The distribution of ER signals in the different combinations over a 2 kb region at the correspoi. (G) Percentage of merged sites between labelled row factors and column factors. (H) The normalized H3K27ac and H3K4me1 signals at the binding patterns identified in the Venn diagrams and by different numbers of TFs over a 2 kb region. The data show that the ERα binding portion is abundantly improved among sites bound by all three factors. (I) Motif enrichment of the sites bound by all three TFs with the Homer software.

