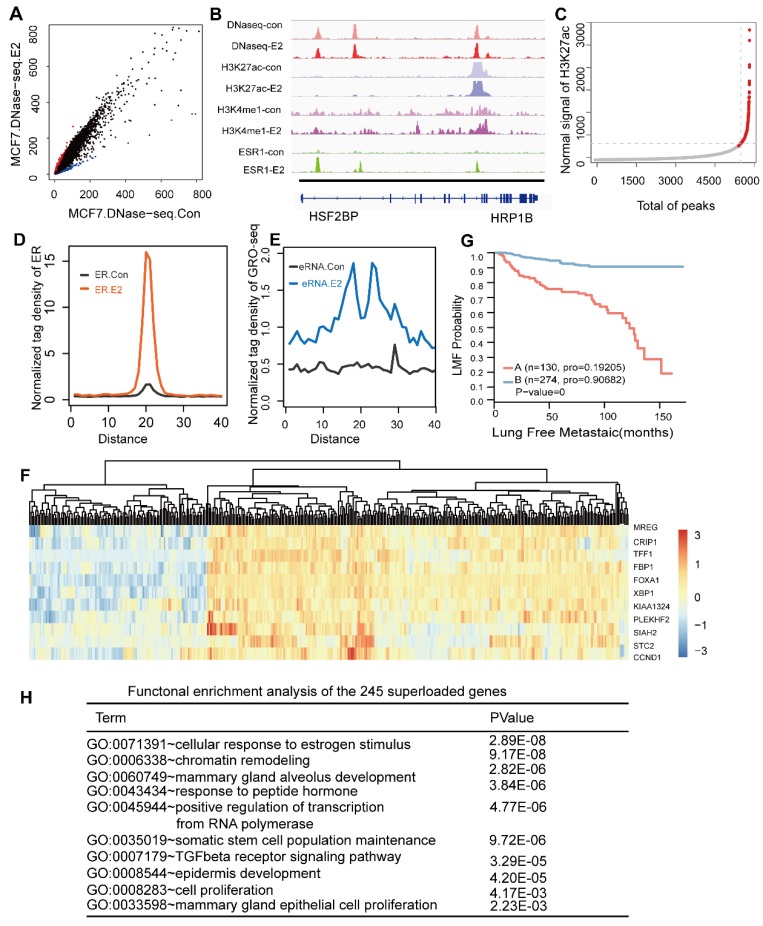
Figure 4.
The ER utilizes a pre-established functional enhancer landscape bound by the PFs associated with the ER core function. (A) Scatterplot of the DHS peak normalized signal found in either the E2-treated or untreated cells demonstrating new E2-induced sites (red) and sites lost in the untreated cells (blue). (B) Shown are examples of DNase I sensitivity, histone modification marker and oestrogen receptor occupancy patterns before and after hormone exposure. (C) Distribution of the H3K27ac ChIP-seq signal across the 6856 sites bound by all TFs. H3K27ac occupancy is not evenly distributed at the regions, with a subset of sites (the 279 super-enhancers) containing exceptionally high H3K27ac signals. (D, E) Normalized tag density distribution of ER ChIP-seq (D) and GRO-seq (E) signals across the 279 super-enhancer region TFs before and after E2 stimulation. (F) The change in the ERα ChIP-seq signal was measured before and after the addition of oestrogen across the 241 aligned genes. The top ten genes with significant differences were used to perform a cluster analysis of the 404 collected patients. The results showed that the patients were obviously clustered into two categories. (G) Kaplan-Meier metastasis analysis of these two groups of patients show a significant difference in the prognosis with a p-value of almost zero. (H) Functional enrichment analysis of 241 genes that were uniquely aligned to the genome using the online DAVID software. The results show that these genes are significantly associated with functional modules, such as oestrogen, chromatin remodelling, mammary gland epithelial cell proliferation and mammary acinar growth (p-value<1e-3).

